
Key Highlights
- Ampol (ASX:ALD), Santos (ASX:STO), Viva (ASX:VEA), and Woodside (ASX:WDS) exhibit the strongest momentum in the Energy sector.
- STO and WDS have completed inverse head and shoulders patterns.
- ALD is forming a potential large-scale inverse head and shoulders pattern.
- VEA is forming a potential inverse head and shoulders pattern.
- Prices are currently facing challenges while testing significant resistance levels. What will happen next?
Following a strong distribution session on March 9, 2026, oil prices (Brent & WTI) rebounded and continue to move higher. They are currently retesting the US$100/barrel level. In the meantime, ASX Energy stocks are also facing resistance while maintaining their overall upward momentum.
Technical Outlook
Energy Sector Relative Momentum Chart
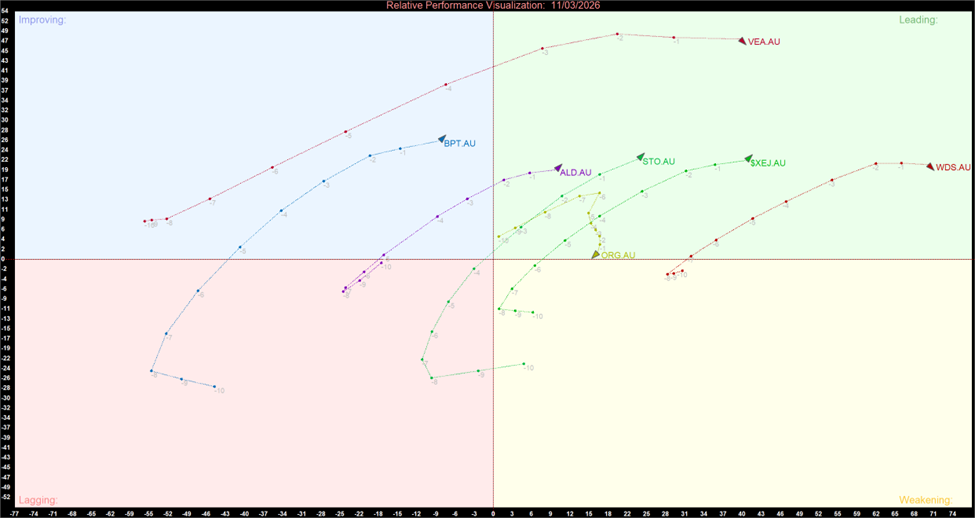
Energy Sector Relative Momentum Chart (at the closing price of 12th March 2026). Powered by: amibroker.com
- Following the Energy Sector Index (XEJ) trend, four stocks, ALD, STO, VEA, and WDS, are exhibiting the strongest momentum, heading deep into the Leading quadrant.
Ampol (ASX: ALD)
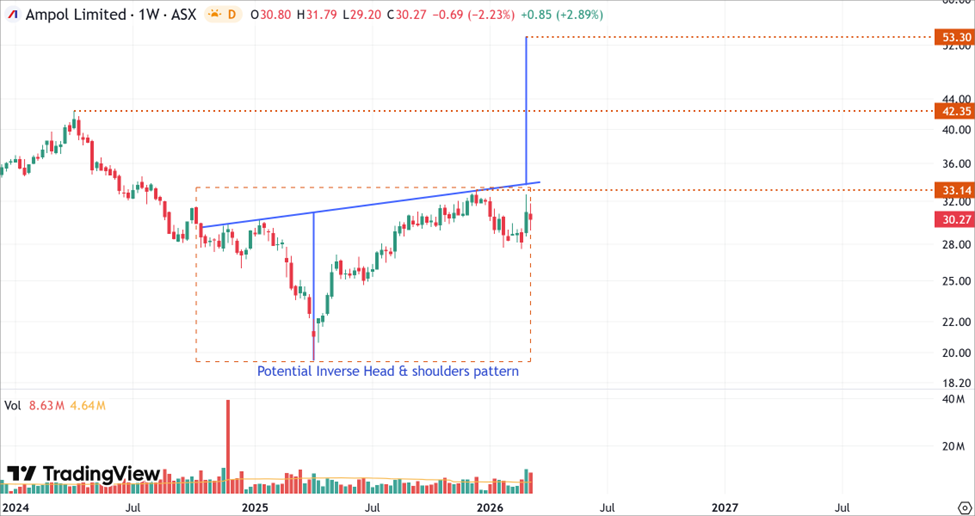
ALD’s Daily Price Chart (at the closing price of 12th March 2026). Powered by: tradingview.com
- ALD’s stock price is developing a large-scale inverse head and shoulders pattern dating back to October 2024. A decisive breakout above the pattern’s neckline at $34.00 could propel the stock toward the projected target of $53.30, although pullbacks may occur near significant resistance established by the April 2024 peak of $42.35.
Santos (ASX:STO)
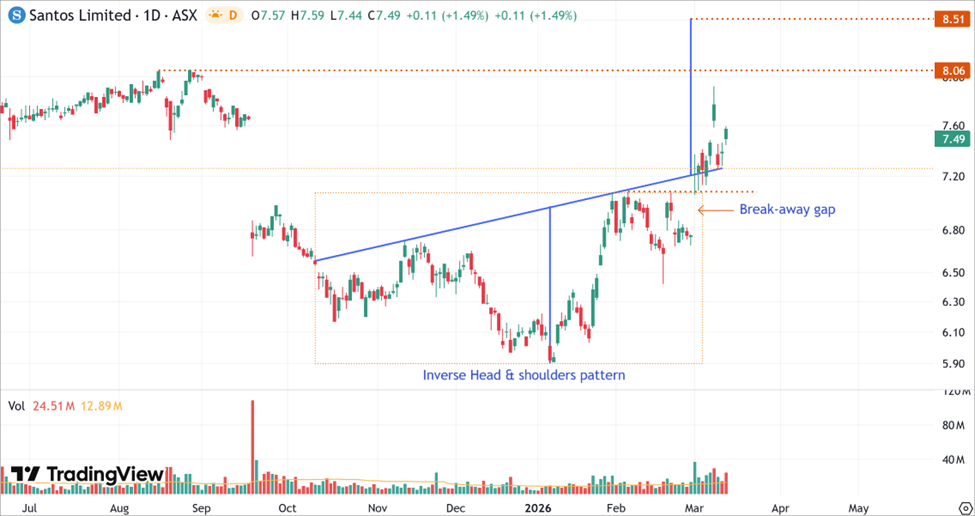
STO’s Daily Price Chart (at the closing price of 12th March 2026). Powered by: tradingview.com
- After completing an inverse head and shoulders pattern, STO’s stock price experienced a pullback when testing the September 2025 peak and is currently rebounding from the pattern’s neckline. This is a common movement after a breakout, and the price target remains in place at the projected level of $8.51.
Viva (ASX:VEA)
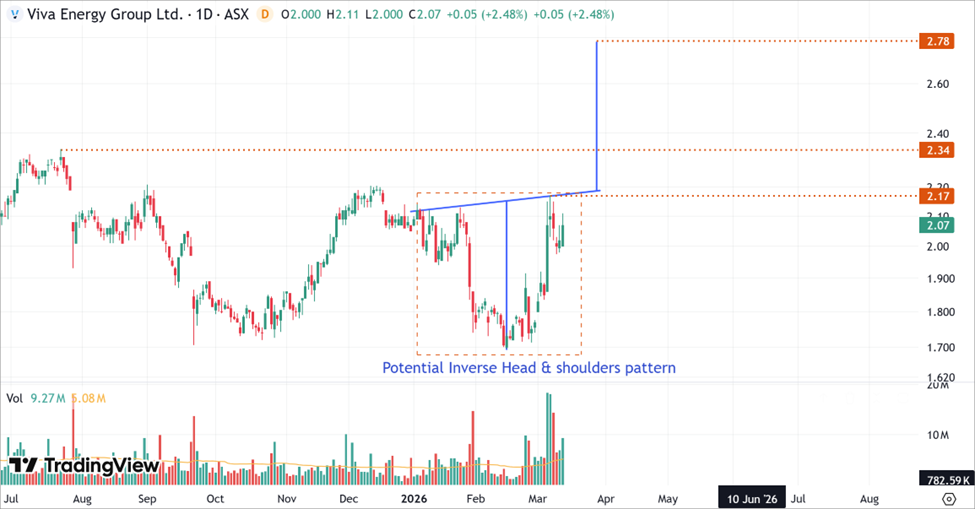
VEA’s Daily Price Chart (at the closing price of 12th March 2026). Powered by: tradingview.com
- Viva Energy (VEA) is currently forming a potential inverse head and shoulders technical setup that has been developing since December 2025. A clear move above the $2.20 resistance level (the pattern’s neckline) would signal a breakout, potentially driving the share price toward a target of $2.75. Investors should watch for possible price consolidation or pullbacks near $2.34, a key resistance level formed by the July 2025 peak.
Woodside (ASX:WDS)
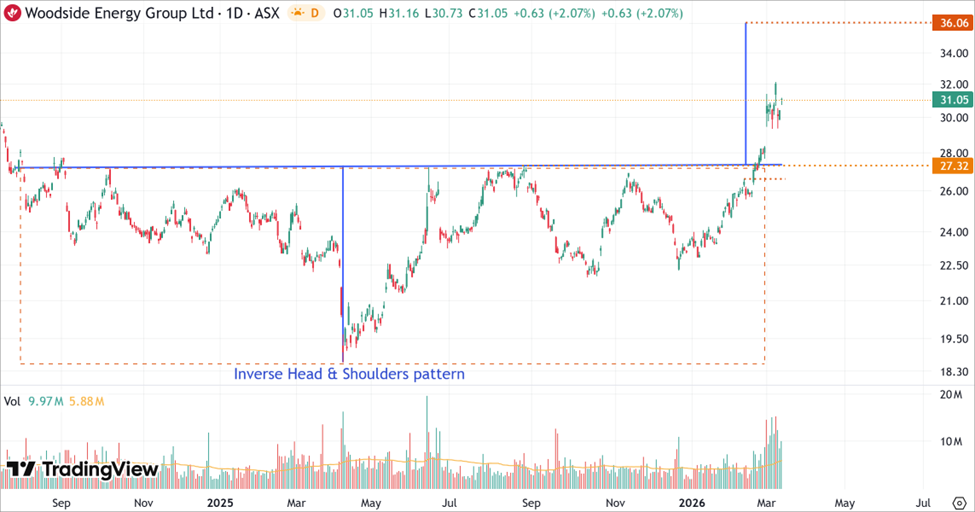
WDS’s Daily Price Chart (at the closing price of 12th March 2026). Powered by: tradingview.com
- After breaking out of its inverse head and shoulders pattern, WDS’s stock price formed a rising window, suggesting that bullish momentum remains strong. While currently in a brief consolidation phase, the price is likely to head higher toward the projected target of $36.06.
Bottom Line
The ASX Energy sector remains the market's primary beneficiary of escalating geopolitical tensions and rebounding oil prices, which are currently retesting the US$100/barrel level. Leading the charge, Ampol (ASX:ALD), Santos (ASX:STO), Viva (ASX:VEA), and Woodside (ASX:WDS) have all pushed deep into the Leading quadrant of the momentum chart. While STO and WDS have already completed bullish inverse head and shoulders breakouts, ALD and VEA are currently developing setups of their own. Despite facing immediate resistance at key historical peaks, the sector's overall upward momentum remains intact, with established price targets suggesting significant further upside if current breakouts are sustained.


 Please wait processing your request...