The Australian share market faced a sharp reversal yesterday, Thursday, March 12, 2026, as a dramatic surge in global oil prices reignited inflation fears and sent interest rate expectations soaring. The S&P/ASX 200 index plummeted 1.35%, closing near 8,625 points, effectively erasing the gains of the previous two sessions.
The narrative of the day was dominated by a single outlier: Energy, which stood as the only sector to post gains while the other ten industry groups retreated into the red.
- Today's Sector Performance Heatmap
The market breadth was notably weak, with roughly 90% of the ASX 200 constituents trading lower.
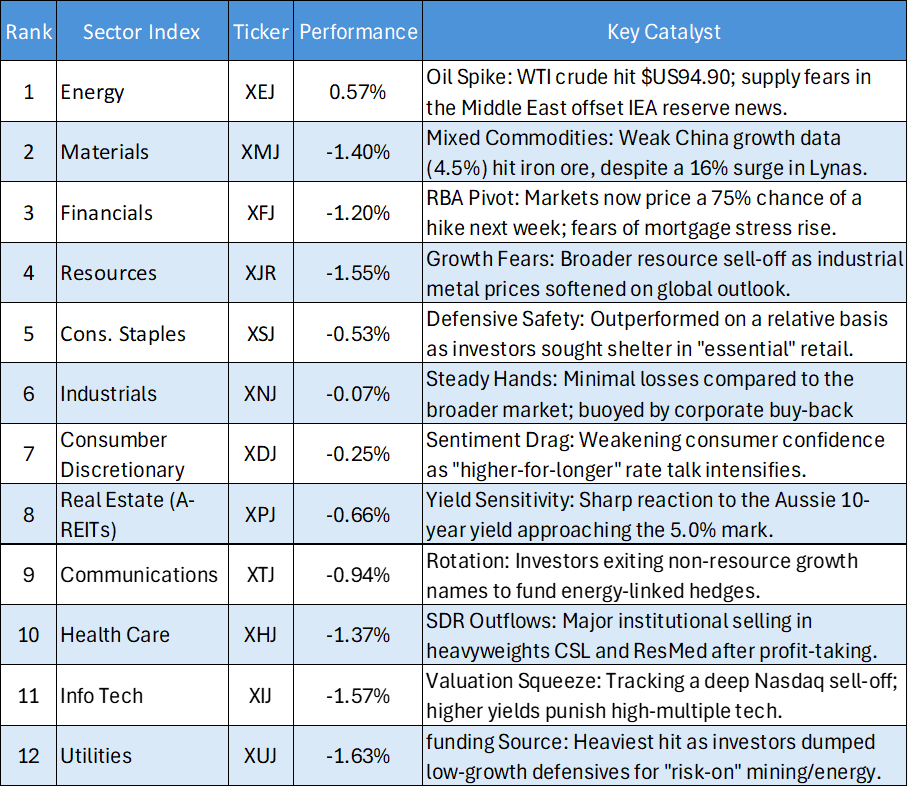
Energy: The Lone Survivor
While the International Energy Agency (IEA) attempted to calm markets by announcing a release of 400 million barrels from strategic reserves, the market largely ignored the move. Attacks in the Strait of Hormuz have kept supply risks at the forefront.
- Woodside Energy (WDS): Rose 1.7% to $30.97.
- Whitehaven Coal (WHC): Jumped 5% following a credit rating boost and rising thermal coal forecasts.
- Santos (STO): Gained 1.6% as investors hedged against sustained high energy costs.
Technology & Real Estate: The Yield Victims
With the Aussie 10-year yield creeping toward the 5% mark, sectors that rely on high growth or carry heavy debt were punished.
- Tech Meltdown: The sector tumbled over 4%, led by software giant WiseTech Global (WTC), which fell 4.6%.
- Property Pain: Goodman Group saw a 3.6% drop as the prospect of "higher-for-longer" rates makes capital-intensive real estate less attractive.
Financials: Bracing for the RBA
The narrative for the banking sector shifted violently today. Markets are now pricing in a 78% chance of a rate hike from the Reserve Bank of Australia (RBA) next week—a massive jump from the 30% probability seen just days ago.
- Big Four: Commonwealth Bank (CBA) and ANZ both faced selling pressure, with ANZ dropping nearly 2%. While higher rates can help margins, the market is currently more concerned about the potential for bad debts and a slowing economy.
- ASX Sector Year-to-date Risk and Yield Mapping
The current Risk and Yield map highlights a clear split in the ASX, strong gains in resources contrasted against a heavy drag on interest-rate-sensitive sectors.
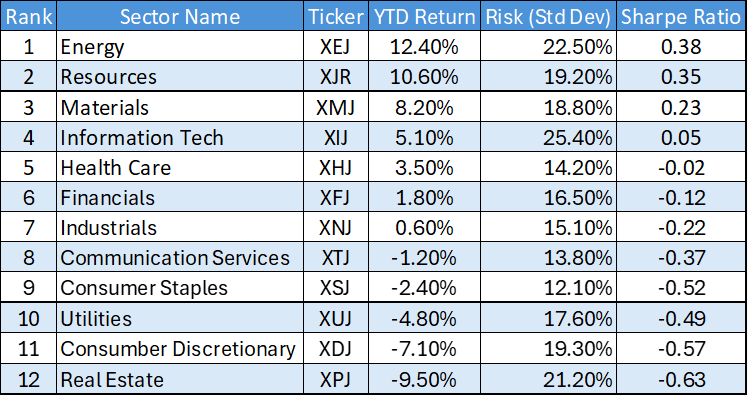
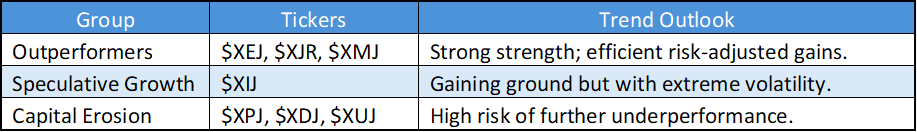
The Dominance of the "Real Assets" Trade
The top three ranks, Energy (XEJ), Resources (XJR), and Materials (XMJ), represent the only portion of the market delivering high positive returns combined with healthy Sharpe Ratios.
- Energy is the clear alpha generator (+12.40%), suggesting that supply-side constraints or geopolitical premiums are significantly outweighing broader economic concerns.
High-Octane Growth vs. Low Risk-Adjusted Return
Information Technology (XIJ) presents a classic "high-risk" profile. While it sits at Rank 4 for raw returns (+5.10%), its Standard Deviation (25.40%) is the highest in the table.
- This volatility results in a near-zero Sharpe Ratio ($0.05$), meaning investors are not being meaningfully compensated for the significant price swings they are enduring in this sector.
The "Yield Trap" in Defensives
Traditionally "safe" defensive sectors like Consumer Staples (XSJ) and Utilities (XUJ) are currently failing as diversifiers.
- Both have negative YTD returns and poor Sharpe Ratios. This indicates that the typical flight-to-safety trade has bypassed these sectors in favor of cash (risk-free rate) or hard commodities.
The Real Estate Liquidation
Real Estate (XPJ) is currently the market’s "danger zone."
- With a -9.50% return and a Sharpe Ratio of -0.63, it is the worst-performing sector by a wide margin. This reflects a structural exit from A-REITs, likely driven by the market pricing in "higher-for-longer" interest rates that pressure property valuations and debt servicing.
Summary Table: Risk vs. Reward
Disclaimer:
This article (“Article”) has been prepared by Kalkine Pty Limited (ABN 34 154 808 312) (Australian financial services licence number 425376) (“Kalkine”) and its related bodies corporate who are authorised to provide general financial product advice. Kalkine.com.au and its associated pages are published by Kalkine.
Any information/advice provided in this article is general in nature and does not take into account your objectives, financial situation or needs. You should therefore consider whether the information is appropriate for your objectives, financial situation and needs before acting upon it.
There may be a Product Disclosure Statement, Information Memorandum or other offer document (“Offer Document”) for the securities or other financial products referred to in Kalkine articles. You should obtain a copy of the Offer Document and consider it before making any decision about whether to acquire the security or financial product.
Kalkine strongly recommends that you seek advice from a financial adviser, stockbroker or other professional (including taxation and legal advice) before acting on any advice/information in this Article or on the Kalkine website. Not all investments are appropriate for all people.
The information in this Article and on Kalkine website has been prepared from a wide variety of sources, which Kalkine, to the best of its knowledge and belief, considers accurate. Kalkine has made every effort to ensure the reliability of the information contained in its articles (including this Article), newsletters and websites. All information represents our views at the date of publication and may change without notice.
The information in this Article does not constitute an offer to sell securities or other financial products or a solicitation of an offer to buy securities or other financial products.
Kalkine does not issue, sell or deal in any financial products.
This Article may contain information on past performance of particular investments. Please note past performance is neither an indicator nor a guarantee of future performance.
To the extent permitted by law, and excluding any dishonesty or gross negligence by Kalkine, Kalkine disclaims and excludes all liability for any direct, indirect, implied, punitive, special, incidental or other consequential loss or damage arising from the use of or reliance on this Article, the Kalkine website and any information published on the Kalkine website without any warranties or representations by Kalkine to you. To the extent the law prohibits or limits this exclusion, Kalkine limits its liability to the resupply of services.
Please also read our Terms & Conditions and Financial Services Guide for further information.
Employees and/or associates of Kalkine and its related entities may hold interests in the securities or other financial products covered in this Article or on the Kalkine website. Any such employees and associates are required to comply with certain safeguards, procedures and disclosures as required by law.
Some of the images/music that may be used in the Article are copyright to their respective owner(s). Kalkine does not claim ownership of any of the pictures displayed/music used in the Article unless stated otherwise. The images/music that may be used in the Article are taken from various sources on the internet, including paid subscriptions or are believed to be in public domain. We have used reasonable efforts to accredit the source wherever it was indicated or was found to be necessary.
Kalkine Media Pty Ltd, an affiliate of Kalkine Pty Ltd, may have received, or be entitled to receive, financial consideration in connection with providing information about certain entity(s) covered on its website.
Copyright 2026 Krish Capital Pty. Ltd. (ABN 61629651510). All Rights Reserved. No part of this Article, or its content, may be reproduced in any form without our prior consent.


 Please wait processing your request...