Kalkine Gold Portfolio
Performance of Kalkine's Gold Portfolio over the time frame
-
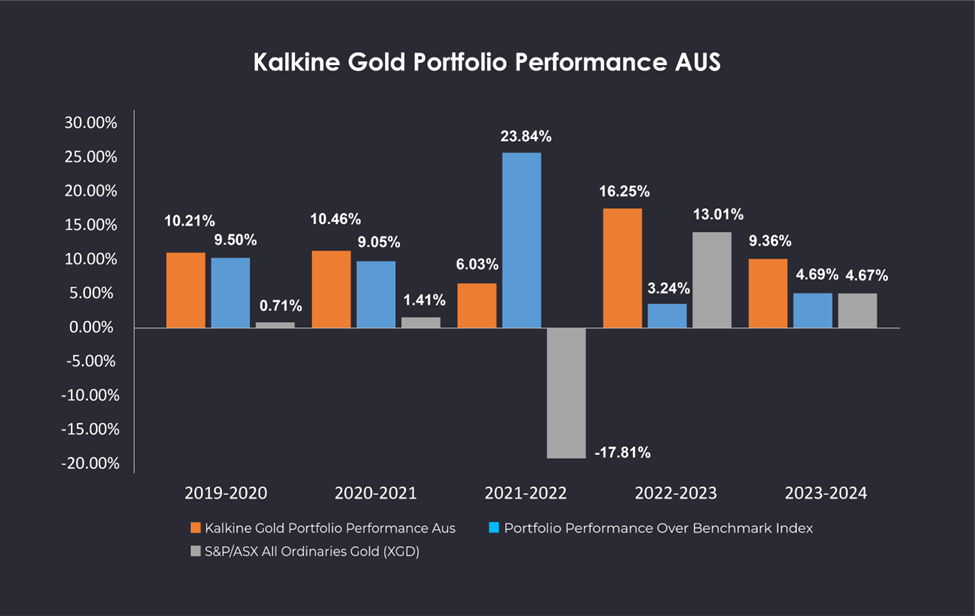
Below we present the performance for stocks included in Kalkine's Gold Portfolio (Hypothetical) for the years 2019-20 (starting July 09, 2019 till January 31, 2020) and 2020-21 (starting Feb 01, 2020 till January 31, 2021). Generally speaking, and given the uncertainty in the market at large, Gold can be one of the best bets to hedge currency risk and add alpha to a portfolio.
- With this backdrop, Kalkine introduced its ‘Gold Report’ on July 09, 2019; and our Hypothetical Gold Portfolio includes a series of stocks that have been evaluated fundamentally and/or technically. These stocks are aimed at providing a hedge against any turbulence in the equity markets.
- Our Portfolio is hypothetical and our performance figures are based on recommendations from Kalkine Gold Reports using stock prices at the date of publication. The performance has been verified by an independent accounting firm. More details on the methodology can be obtained from the 'Performance Methodology' section that gives a snippet of approach used for calculating the performance.
- All investors are advised to conduct their own independent research into individual stocks recommended by Kalkine before making a purchase decision. In addition, investors are advised that past stock performance is no guarantee of future price appreciation.
- We encourage you to think of investing as a long-term pursuit.
Data Source: Kalkine, REFINITIV, for respective period mentioned above
Note 1: The performance numbers do not take into account any transaction fees or charges levied
Note 2: Hypothetical performance may differ materially from results or returns ultimately achieved. Past performance is not a reliable indicator of future performance.
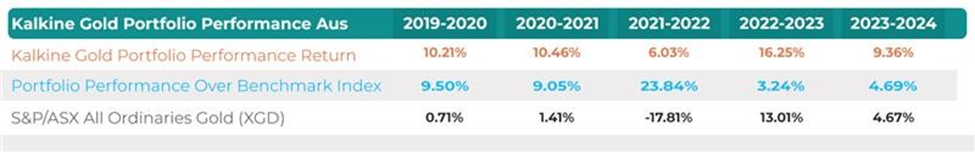
Performance since the launch of ‘Gold Report’
Kalkine Technology Portfolio
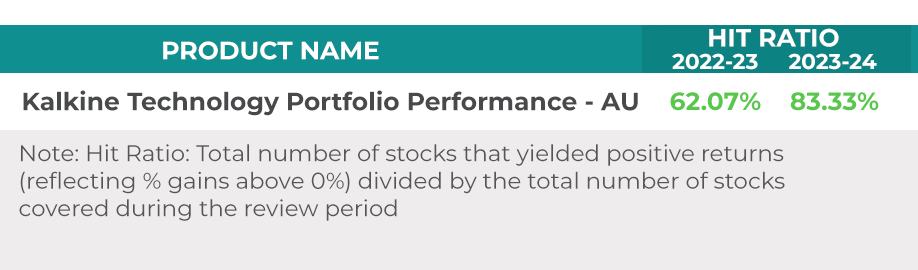
Performance of Kalkine's Technology Portfolio over the time frame
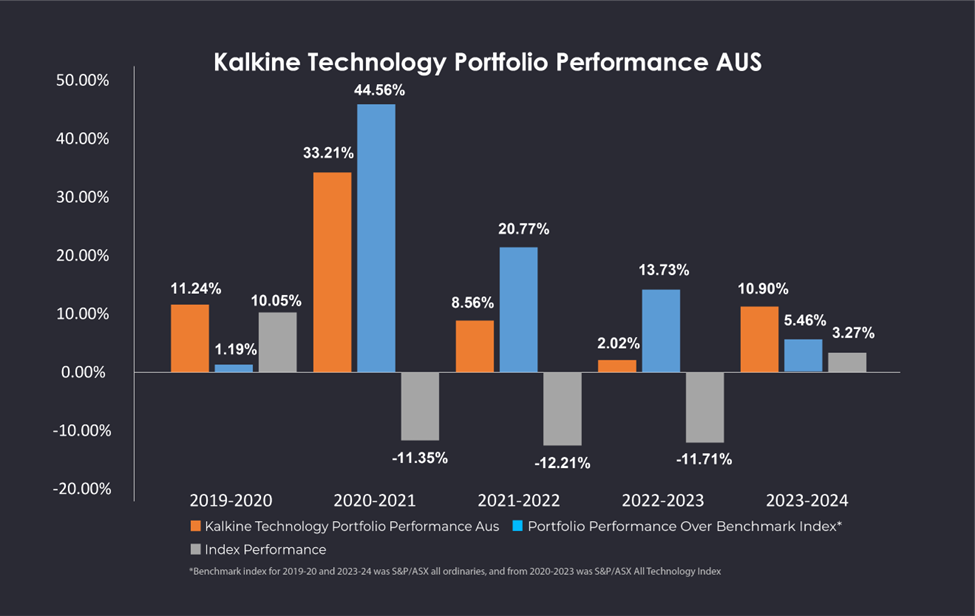
- Below we present the performance of stocks in Kalkine’s Technology Portfolio (Hypothetical) over the past couple of years with first year starting from April 26,2019 to January 31, 2020 and remaining years as per fiscal year starting 1st February till 31st January. Generally speaking, digital era is driving transformation across almost all the sectors across the globe. The technology sector usually commands decent valuations and investors can benefit from returns from high growth tech businesses. Tech space can also be one’s ally to make money while the economy slumbers.
- Looking at the prospects, Kalkine introduced its ‘Technology Report’ on April 26, 2019. Our Hypothetical Technology Portfolio includes a series of Tech stocks that have been evaluated fundamentally and/ or technically. These stocks are aimed at providing opportunities across information technology, healthcare, industrials, mining space etc. wherein technology forms the basis of future potential.
- Our Portfolio is hypothetical and our performance figures are based on recommendations from Kalkine Technology Reports using stock prices at the date of publication. The performance has been verified by an independent accounting firm. More details on the methodology can be obtained from the 'Performance Methodology' section that gives a snippet of approach used for calculating the performance. Portfolio Performance has been compared with XSO Index as ASX Technology Index was launched in Feb’ 20, and most of the stocks in Kalkine’s Portfolio belong to small-cap category as of now.
- All investors are advised to conduct their own independent research into individual stocks recommended by Kalkine before making a purchase decision. In addition, investors are advised that past stock performance is no guarantee of future price appreciation.
- We encourage you to think of investing as a long-term pursuit.
Data Source: Kalkine, REFINITIV, for respective period mentioned above
Note 1: The performance numbers do not take into account any transaction fees or charges levied
Note 2: Hypothetical performance may differ materially from results or returns ultimately achieved. Past performance is not a reliable indicator of future performance.
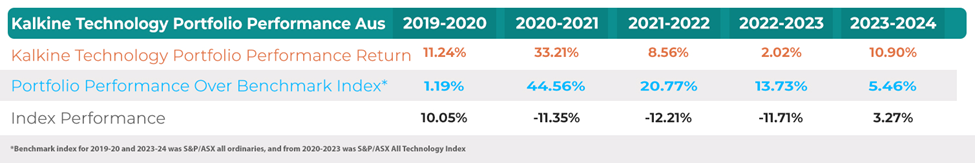
Performance since the launch of 'Technology Report'
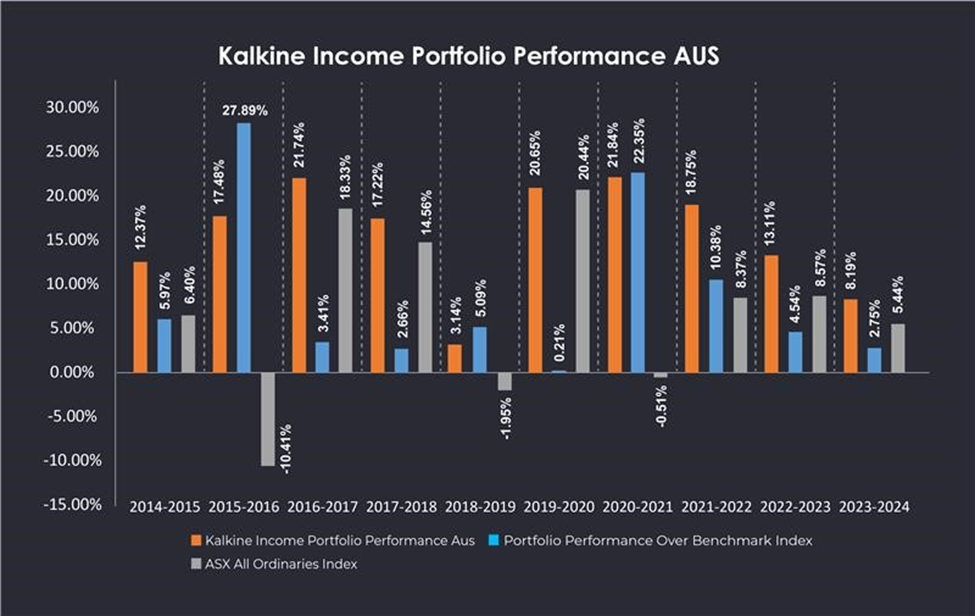
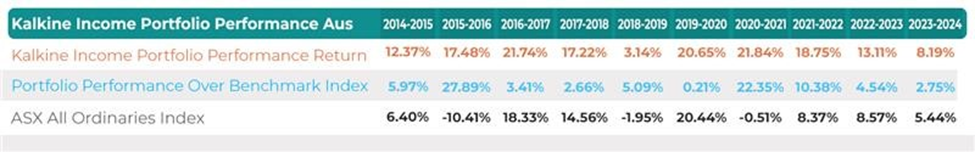
Kalkine Income Portfolio
Performance of Kalkine's Income Portfolio over the time frame
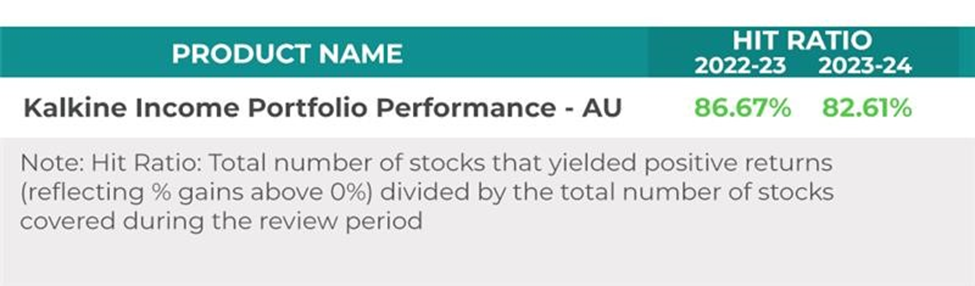
- Below we present performance for stocks included in Kalkine's Income Portfolios (Hypothetical) for years 2014-2023. Generally speaking, Kalkine Income Portfolios for the four years represent hypothetical portfolios and these consist of stocks that have either paid dividends in the periods mentioned above or have been identified as good income stocks based on their potential to pay dividends in the near future.
- Our Portfolio is hypothetical and our performance figures are based on recommendations from Kalkine Reports (such as Investor Reports and respective daily reports) using stock prices at the date of publication. The performance has been verified by an independent accounting firm. More details on the methodology can be obtained from the 'Performance Methodology' section that gives a snippet of approach used for calculating the performance.
- All investors are advised to conduct their own independent research into individual stocks recommended by Kalkine before making a purchase decision. In addition, investors are advised that past stock performance is no guarantee of future price appreciation.
- We encourage you to think of investing as a long-term pursuit.
Data Source: Kalkine, REFINITIV, for respective period mentioned above
Note 1: The performance numbers do not take into account any transaction fees or charges levied
Note 2: Hypothetical performance may differ materially from results or returns ultimately achieved. Past performance is not a reliable indicator of future performance.

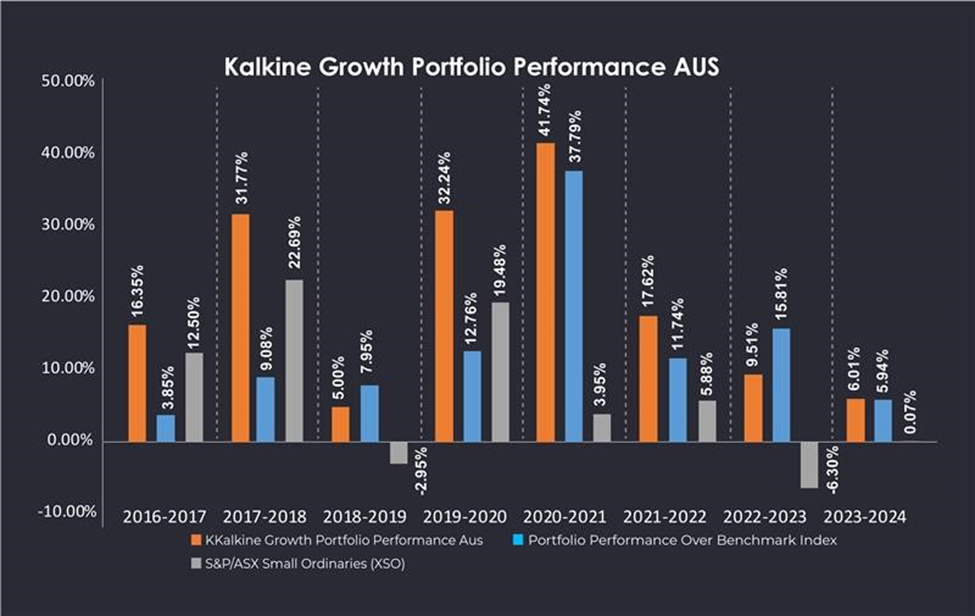
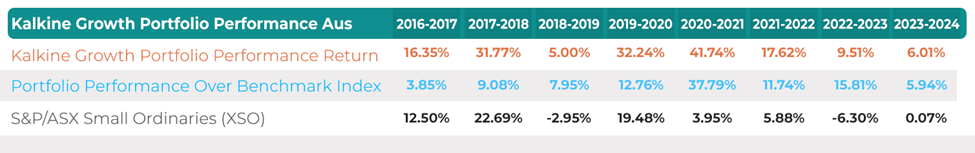
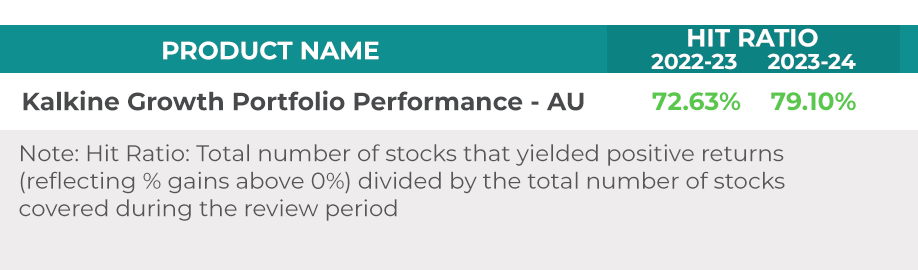
Kalkine Growth Portfolio - Australia
Performance of Kalkine's Growth Portfolio over the time frame
We encourage you to think of investing as a long-term pursuit.
Data Source: Kalkine, REFINITIV, for respective period mentioned above
Note 1: The performance numbers do not take into account any transaction fees or charges levied
Note 2: Hypothetical performance may differ materially from results or returns ultimately achieved. Past performance is not a reliable indicator of future performance.

Kalkine Portfolio Performance USA
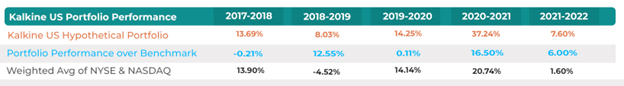
Fast-track guide to how our portfolio performed during 2021-2022
- Below, we present the performance of stocks included in Kalkine Portfolio- USA for the year 2021-2022, starting from April 14th, 2021, till April 13, 2022.
- Our performance figures are hypothetical and based on recommendations and respective prices mentioned in the report. The performance has been verified by an independent accounting firm. More details on the methodology can be obtained from the 'Performance Methodology' section that gives a snippet of the approach used for calculating the performance.
- All investors are advised to conduct their own independent research into individual stocks recommended by Kalkine before making a purchase decision. In addition, investors are advised that past stock performance is no guarantee of future price appreciation.
- We encourage you to think of investing as a long-term pursuit.
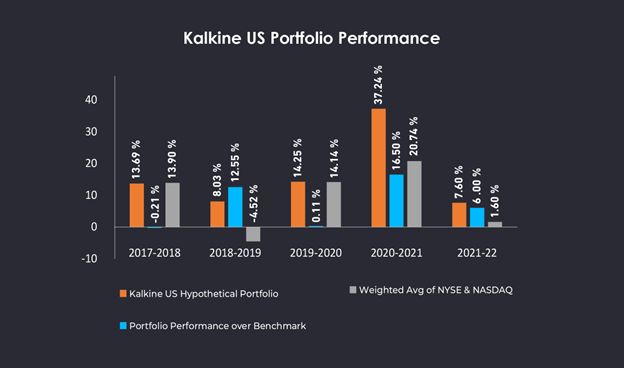
Data Source: Kalkine, REFINITIV, for respective period mentioned above. The benchmark index used for the years 2017-2021 is Russell 3000 value index, and for the year 2021-2022 is weighted average of NYSE Index and Nasdaq composite Index weighted by the number of stocks covered in the portfolio during the review period.
Note 1: The performance numbers do not take into account any transaction fees or charges levied
Note 2: Hypothetical performance may differ materially from results or returns ultimately achieved. Past performance is not a reliable indicator of future performance.
Performance since the launch of 'US Equities Report'
Hit Ratio refers to number of stocks yielding positive returns (greater than 0%) divided by total number of stocks covered during the review period i.e. from 14th April 2021 to 13th April 2022.

Kalkine Healthcare Portfolio – Australia
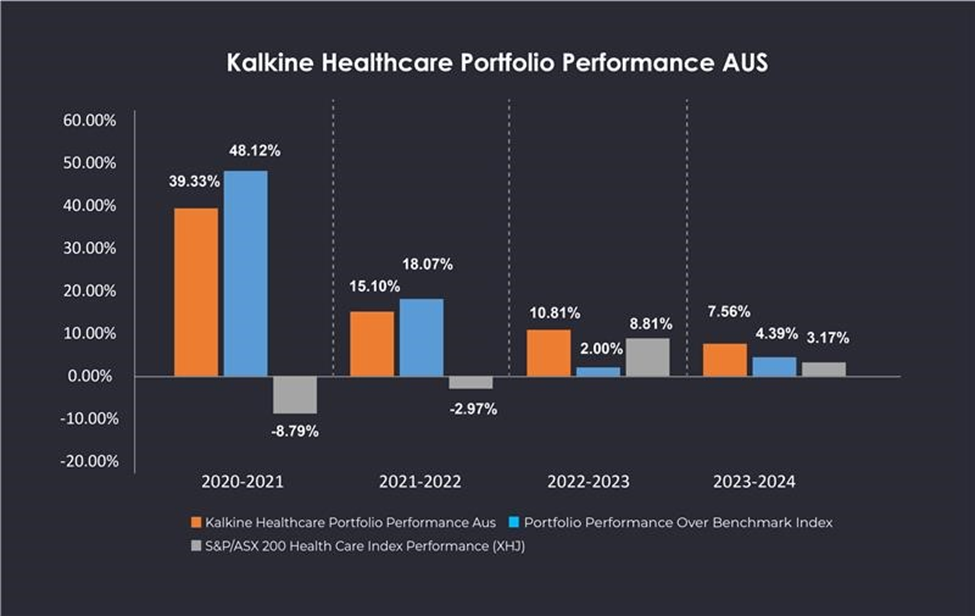
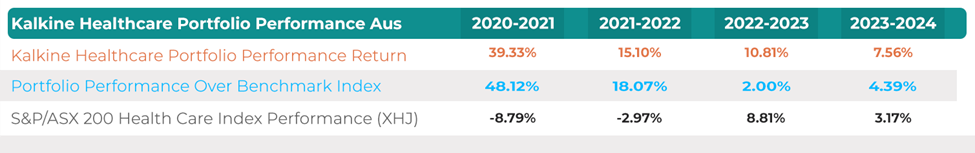
Performance of Kalkine's Healthcare Portfolio over the time frame:
- Below we present the performance of stocks in Kalkine’s Healthcare Portfolio (Hypothetical) over the past couple of years (Year ending 1st February – 31st January 2023).
- With this backdrop, Kalkine introduced its ‘Healthcare’ Report on 4th December 2019, and our ‘Hypothetical’ Healthcare Portfolio includes a list of stocks that have been evaluated fundamentally and or technically.
- Our performance figures are hypothetical and based on Kalkine’s Healthcare Reports using stock prices as on the date of publication. The performance has been verified by an independent accounting firm. More details on the methodology can be obtained from the ‘Performance Methodology’ section that gives a snippet of approach used for calculating the performance.
- The performance of stocks in Kalkine’s Healthcare portfolio (hypothetical) has been calculated based on their current price values during the specific time periods to give ‘as on date’ performance picture.
- All Investors are advised to conduct their own independent research into individual stocks recommended by Kalkine before making a purchase decision. In addition, investors are advised that past stock performance is no guarantee of future price appreciation.
- We encourage you to think of Investing as a Long-Term Pursuit.
Data Source: Kalkine, REFINITIV, for respective period mentioned above
Note 1: The performance numbers do not take into account any transaction fees or charges levied
Note 2: Hypothetical performance may differ materially from results or returns ultimately achieved. Past performance is not a reliable indicator of future performance.
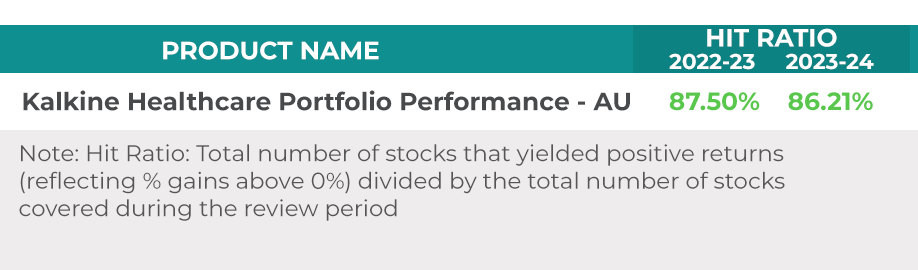
Kalkine’s Healthcare (Hypothetical) Portfolio Performance for the period starting 4th December 2019 till 31st January 2020 was 3.37% returns as verified by an independent accounting firm. Due to the small number of stocks covered during the first two months till 31st January 2020, only the performance since 1st February 2020 – 31st January 2021 has been reflected in the above table.
Kalkine Stocks Under 20 Cents Portfolio - Australia
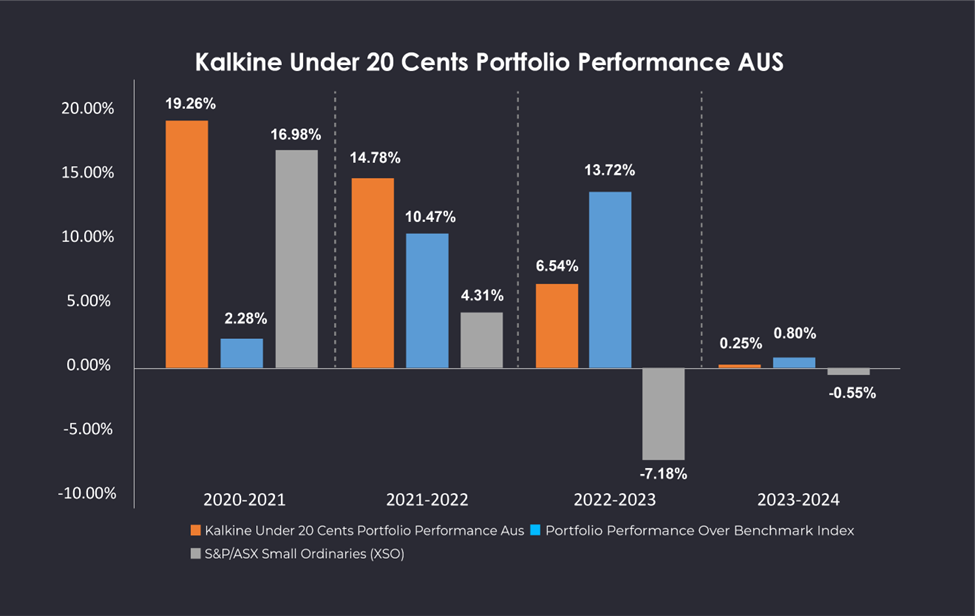
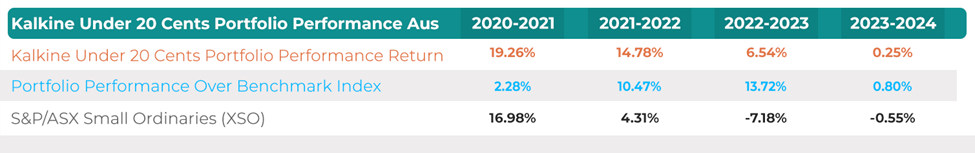
Performance of Kalkine's Stocks Under 20 Cents Portfolio over the time frame’
- Below we present the performance for stocks included in Kalkine's Under 20 Cents Portfolio (Hypothetical) for the years 2020-21 starting July 31, 2020, till January 31, 2023.
- With this backdrop, Kalkine introduced its ‘Under 20 Cents Report’ on July 31, 2020; and our Hypothetical 20 Cents Portfolio includes a series of stocks that have been evaluated predominantly with technical parameters. This report covers young companies with stock prices below 20 cents. Recommendations are based on development programs, business strategies, and quality of management that holds a premise for long-term potential.
- Our Portfolio is hypothetical, and our performance figures are based on recommendations from Kalkine Under 20 Cents Reports using stock prices at the date of publication. The performance has been verified by an independent accounting firm. More details on the methodology can be obtained from the 'Performance Methodology' section that gives a snippet of approach used for calculating the performance.
- All investors are advised to conduct their own independent research into individual stocks recommended by Kalkine before making a purchase decision. In addition, investors are advised that past stock performance is no guarantee of future price appreciation.
- We encourage you to think of investing as a long-term pursuit.
Data Source: Kalkine, REFINITIV, for respective period mentioned above
Note 1: The performance numbers do not take into account any transaction fees or charges levied
Note 2: Hypothetical performance may differ materially from results or returns ultimately achieved. Past performance is not a reliable indicator of future performance.

Performance since the launch of ’ Under 20 Cents Report’
Kalkine Global Green Energy Portfolio
Performance of Kalkine's Global Green Energy over the time frame
- Below we present performance for stocks included in Kalkine’s Global Green Energy Portfolio (Hypothetical) for year 2021 (2nd Dec 2020 – 1st Dec 2021). Typically, Kalkine’s Global Green Energy Portfolio represents hypothetical portfolio and it consists of globally listed stocks (Australia, US, Canada, UK, and New Zealand) with decent fundamentals from renewable energy space such as wind, solar, hydro, and geothermal producers, independent power producers, natural gas providers, equipment manufacturers, and service providers etc.
- Dividend Yield for the Benchmark Index is assumed to be in-line with the yield provided as per the portfolio stocks during the said period.
- Our Portfolio is hypothetical, and our performance figures are based on recommendations from Kalkine Reports (such Global Green Energy Reports and respective daily reports) using stock prices at the date of publication. The performance has been verified by an independent accounting firm.

Data Source: Kalkine, REFINITIV, for respective period mentioned above
Note 1: The performance numbers do not take into account any transaction fees or charges levied
Note 2: Hypothetical performance may differ materially from results or returns ultimately achieved. Past performance is not a reliable indicator of future performance.

Hit Ratio refers to number of stocks yielding positive returns (greater than 0%) divided by total number of stocks covered during the review period 2021-2022.

Kalkine Global Fully Charged Portfolio
Performance of Kalkine's Global Fully Charged over the time frame
- Below we present performance for stocks included in Kalkine’s Global Fully Charged Portfolio (Hypothetical) for year 2021 (23rd Feb 2021 – 1st Dec 2021) and year 2022 (2nd Dec 2021-1st Dec 2022). Typically, Kalkine’s Global Fully Charged Portfolio represents hypothetical portfolio represents hypothetical portfolio and it consists of globally listed stocks (Australia, US, New Zealand etc.) with decent fundamentals from the battery-cell and auto manufacturers, chemical businesses, solar and utility operators, lithium-ion battery manufacturers etc.
- Dividend Yield for the Benchmark Index is assumed to be in-line with the yield provided as per the portfolio stocks during the said period.
- Our Portfolio is hypothetical, and our performance figures are based on recommendations from Kalkine Reports (such Global Fully Charged Reports and respective daily reports) using stock prices at the date of publication. The performance has been verified by an independent accounting firm.

Data Source: Kalkine, REFINITIV, for respective period mentioned above
Note 1: The performance numbers do not take into account any transaction fees or charges levied
Note 2: Hypothetical performance may differ materially from results or returns ultimately achieved. Past performance is not a reliable indicator of future performance.

Hit Ratio refers to number of stocks yielding positive returns (greater than 0%) divided by total number of stocks covered during the review period 2021-2022.

Kalkine US Equities Portfolio
Performance of Kalkine's US Equities Portfolio over the time frame
- Below we present performance for stocks included in Kalkine's US Equities Portfolio (Hypothetical) for the year 2021-2022 starting April 14, 2021, till April 13, 2022. Generally speaking, digital era is driving transformation across almost all the sectors across the globe. The US Equities Portfolio focused on diversifying investments across the heterogeneity of US stock market to balance risk and reward.
- Looking at the prospects, the Hypothetical US Equities Portfolio includes a series of growth, defensive, cyclical stocks and others that have been evaluated fundamentally and/ or technically. These stocks are aimed at providing opportunities across the heterogeneity of US stock market and balance risk and reward.
- Our Portfolio is hypothetical, and our performance figures are based on recommendations from Kalkine US Equities Reports using stock prices at the date of publication. The performance has been verified by an independent accounting firm. More details on the methodology can be obtained from the 'Performance Methodology' section that gives a snippet of approach used for calculating the performance. Portfolio Performance has been compared against NYSE and NASDAQ Composite Index (weightage of index assigned according of number of stocks covered from the respective indices)
- All investors are advised to conduct their own independent research into individual stocks recommended by Kalkine before making a purchase decision. In addition, investors are advised that past stock performance is no guarantee of future price appreciation.
- We encourage you to think of investing as a long-term pursuit.

Data Source: Kalkine, REFINITIV, for respective period mentioned above.
Note 1: The performance numbers do not take into account any transaction fees or charges levied
Note 2: Hypothetical performance may differ materially from results or returns ultimately achieved. Past performance is not a reliable indicator of future performance.

Hit Ratio refers to number of stocks yielding positive returns (greater than 0%) divided by total number of stocks covered during the review period i.e. from 14th April 2021 to 13th April 2022.

Kalkine US Equities Portfolio
Below is a snippet of the methodology used for KALKINE Portfolio Performance Calculation
KALKINE US Equities Portfolio Performance (Year-on-Year)
Recommendations under Kalkine’s US Equities Portfolio (Hypothetical) for the year 2021-2022 (period from 14 April 2021 to 13 April 2022).
Generally speaking, Kalkine US Equities Portfolio represents a hypothetical portfolio, and this consists of stocks that appear to be providing value while commanding decent valuations and investors can benefit from portfolio diversification across the different stock market categorization, sectors and recurring income generating stocks (Dividend stocks).
Our Portfolio is hypothetical, and our performance figures are based on recommendations from Kalkine US Equities Reports using stock prices at the date of publication.
It is also prudent to note that performance of stocks included in Kalkine US Equities Portfolio (Hypothetical) has been calculated based on their price values during the specific time period in order to give ‘as-on-date’ performance picture.
Where a stock has been recommended multiple times, the average price is taken into consideration. We might need to provide update on a stock several times during a year or for the length of coverage and for that reason the average BUY price is taken into consideration.
Performance figures quoted do not take into account transaction fees and charges. The profits or losses are hypothetical and include dividends or distribution for the length of the coverage until the recommendation is designated as closed.
The performance has been verified by an independent accounting firm.
All investors are advised to conduct their own independent research into individual stocks recommended by Kalkine before making a purchase decision. In addition, investors are advised that past stock performance is no guarantee of future price appreciation.
We encourage you to think of investing as a long-term pursuit.
Note: For any benchmark index return, proportional dividend yields have been taken onto account as per the information available
Kalkine American Technology Portfolio
Performance of Kalkine's American Technology Portfolio over the time frame
- Below we present performance for stocks included in Kalkine's American Technology Portfolio (Hypothetical) for the year 2021-2022 starting April 14, 2021, till April 13, 2022. Generally speaking, digital era is driving transformation across almost all the sectors across the globe. The technology sector usually commands decent valuations and investors can benefit from returns from high growth tech businesses. Tech space can also be one’s ally to make money while the economy slumbers.
- Looking at the prospects, Kalkine introduced its ‘Technology Report’ on April 20, 2021. Our Hypothetical Technology Portfolio includes a series of Tech stocks that have been evaluated fundamentally and/ or technically. These stocks are aimed at providing opportunities across information technology, healthcare, industrials, mining space etc. wherein technology forms the basis of future potential.
- Our Portfolio is hypothetical, and our performance figures are based on recommendations from Kalkine Technology Reports using stock prices at the date of publication. The performance has been verified by an independent accounting firm. More details on the methodology can be obtained from the 'Performance Methodology' section that gives a snippet of approach used for calculating the performance. Portfolio Performance has been compared against Nasdaq Composite Index and most of the stocks in Kalkine’s American Technology Portfolio are constituent of NASDAQ Composite Index and diversified across the market categorization.
- All investors are advised to conduct their own independent research into individual stocks recommended by Kalkine before making a purchase decision. In addition, investors are advised that past stock performance is no guarantee of future price appreciation.
- We encourage you to think of investing as a long-term pursuit.

Data Source: Kalkine, REFINITIV, for respective period mentioned above.
.jpg)

Kalkine Technology Portfolio Methodology
Below is a snippet of the methodology used for KALKINE Portfolio Performance Calculation
KALKINE American Technology Portfolio Performance (Year-on-Year)
Recommendations under Kalkine’s American Technology Portfolio (Hypothetical) for the year 2021-2022 (period from 14 April 2021 to 13 April 2022).
Generally speaking, Kalkine American Technology Portfolio represents a hypothetical portfolio, and this consists of stocks that appear to be providing good value while commanding decent valuations and investors can benefit from returns from high growth businesses. This category may include speculative stocks expected to have growth prospects but carry some defined cited risks.
Our Portfolio is hypothetical, and our performance figures are based on recommendations from Kalkine American Technology Reports using stock prices at the date of publication.
It is also prudent to note that performance of stocks included in Kalkine American Technology Portfolio (Hypothetical) has been calculated based on their price values during the specific time period in order to give ‘as-on-date’ performance picture.
Where a stock has been recommended multiple times, the average price is taken into consideration. We might need to provide update on a stock several times during a year or for the length of coverage and for that reason the average BUY price is taken into consideration.
Performance figures quoted do not consider transaction fees and charges. The profits or losses are hypothetical and include dividends or distribution for the length of the coverage until the recommendation is designated as closed.
The performance has been verified by an independent accounting firm.
All investors are advised to conduct their own independent research into individual stocks recommended by Kalkine before making a purchase decision. In addition, investors are advised that past stock performance is no guarantee of future price appreciation.
We encourage you to think of investing as a long-term pursuit.
Note: For any benchmark index return, proportional dividend yields have been taken onto account as per the information available
Performance of Kalkine's Global Big Money Portfolio over the time frame
- Below we present the performance for stocks included in Kalkine's Global Big Money Portfolio (Hypothetical) for the years 2021-22 (starting August 04, 2021, till August 4, 2022). Generally speaking, and given the uncertainty in the market at large, fundamentally sound stocks in mid-cap to blue-chip space can be considered for hedging the risk, adding alpha to a portfolio.
- With this backdrop, Kalkine introduced its ‘Global Big Money Report’ on August 04, 2021; and our Hypothetical Global Big Money Portfolio includes a series of stocks that have been evaluated fundamentally and/or technically. These stocks are typically aimed at providing sustainable dividend income or can act as a defensive bet against volatility in the market.
- Our Portfolio is hypothetical, and our performance figures are based on recommendations from Kalkine’s Global Big Money Reports using stock prices at the date of publication. The performance has been verified by an independent accounting firm.
- Dividend Yield for the Benchmark Index is assumed to be in-line with the yield provided as per the portfolio stocks during the said period.
- All investors are advised to conduct their own independent research into individual stocks recommended by Kalkine before making a purchase decision. In addition, investors are advised that past stock performance is no guarantee of future price appreciation.
- We encourage you to think of investing as a long-term pursuit.

Note 1: The performance numbers do not take into account any transaction fees or charges levied.
Note 2: Hypothetical performance may differ materially from results or returns ultimately achieved. Past performance is not a reliable indicator of future performance.


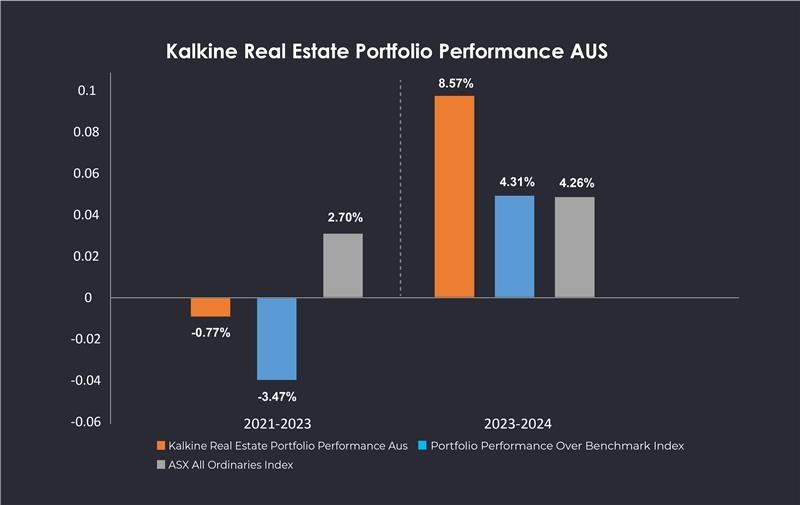
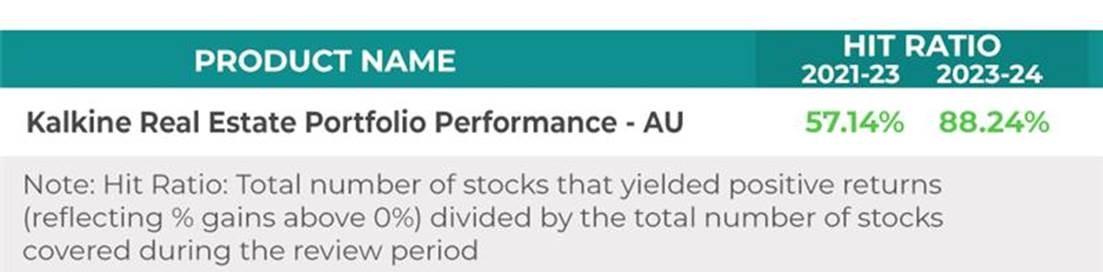
Performance of Kalkine's Real Estate Portfolio over the time frame
- Below we present the performance for stocks included in Kalkine's Real Estate Portfolio (Hypothetical) for the first year starting 2021-22 (starting 19 October, 2021, till January 31, 2023). Generally speaking, and given the uncertainty in the market at large, Gold can be one of the best bets to hedge currency risk and add alpha to a portfolio.
- With this backdrop, Kalkine introduced its ‘Real Estate’ Report on 19 October 2021; and our Hypothetical Real Estate Portfolio includes a series of stocks that have been evaluated fundamentally and/or technically. These stocks are aimed at providing a hedge against any turbulence in the equity markets.
- Our Portfolio is hypothetical, and our performance figures are based on recommendations from Kalkine Real Estate Reports using stock prices at the date of publication. The performance has been verified by an independent accounting firm. More details on the methodology can be obtained from the 'Performance Methodology' section that gives a snippet of approach used for calculating the performance.
- All investors are advised to conduct their own independent research into individual stocks recommended by Kalkine before making a purchase decision. In addition, investors are advised that past stock performance is no guarantee of future price appreciation.
- We encourage you to think of investing as a long-term pursuit.

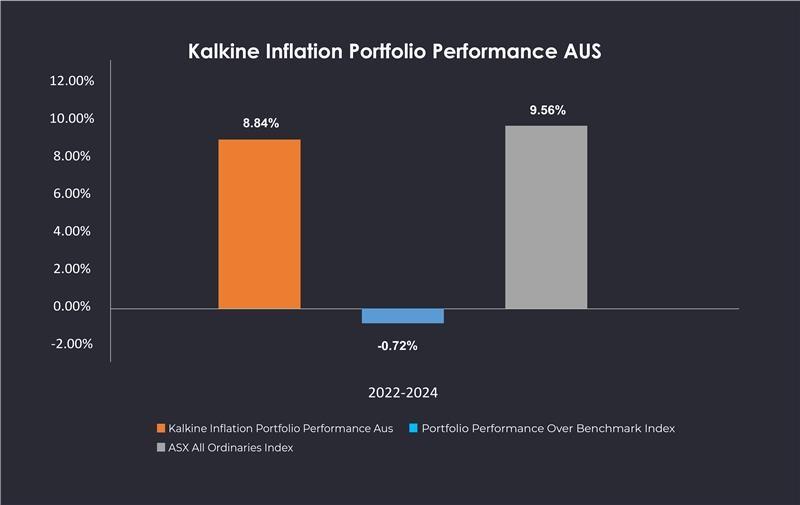
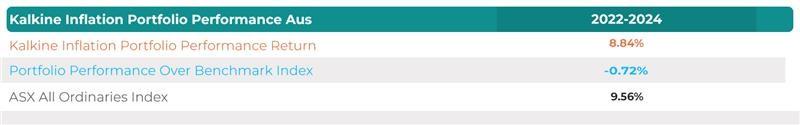
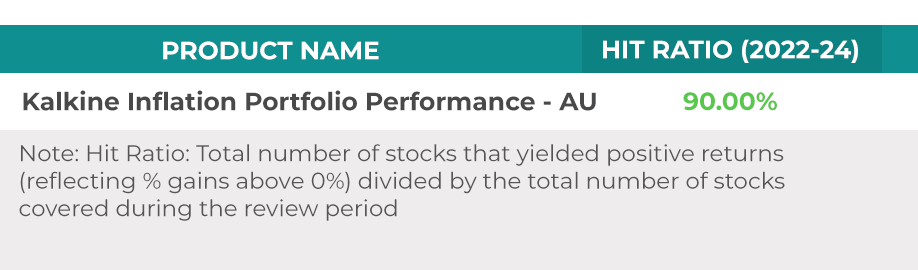
Performance of Kalkine's Inflation Portfolio over the time frame
- Below we present the performance for stocks included in Kalkine’s Inflation Portfolio (Hypothetical) for the first year starting 2022-24 (starting 22 December 2022, till January 31, 2024).
- With this backdrop, Kalkine introduced its ‘Inflation’ Report on 22 December 2022; and our Hypothetical Inflation Portfolio includes a series of stocks that have been evaluated fundamentally and/or technically. These stocks are aimed at providing a hedge against any turbulence in the equity markets.
- Our Portfolio is hypothetical, and our performance figures are based on recommendations from Kalkine Inflation Reports using stock prices at the date of publication. The performance has been verified by an independent accounting firm. More details on the methodology can be obtained from the 'Performance Methodology' section that gives a snippet of approach used for calculating the performance.
- All investors are advised to conduct their own independent research into individual stocks recommended by Kalkine before making a purchase decision. In addition, investors are advised that past stock performance is no guarantee of future price appreciation.
- We encourage you to think of investing as a long-term pursuit.
Disclaimer
The advice given by Kalkine Pty Ltd and
provided on this website is general information only and it does not take into account your investment
objectives, financial situation or needs. You should therefore consider whether the advice is appropriate to
your investment objectives, financial situation and needs before acting upon it. You should seek advice from a
financial adviser, stockbroker or other professional (including taxation and legal advice) as necessary before
acting on any advice. Not all investments are appropriate for all people. Kalkine.com.au and associated pages
are published by Kalkine Pty Ltd ABN 34 154 808 312 (Australian Financial Services License Number 425376).The
information on this website has been prepared from a wide variety of sources, which Kalkine Pty Ltd, to the best
of its knowledge and belief, considers accurate. You should make your own enquiries about any investments and we
strongly suggest you seek advice before acting upon any recommendation. All information represents our views at
the date of publication and may change without notice. To the extent permitted by law, Kalkine Pty Ltd excludes
all liability for any loss or damage arising from the use of this website and any information published
(including any indirect or consequential loss, any data loss or data corruption). If the law prohibits this
exclusion, Kalkine Pty Ltd hereby limits its liability, to the extent permitted by law to the resupply of
services. There may be a product disclosure statement or other offer document for the securities and financial
products we write about in Kalkine Reports. You should obtain a copy of the product disclosure statement or
offer document before making any decision about whether to acquire the security or product. The link to
our Terms & Conditions has been
provided please go through them and also have a read of the Financial Services Guide.
On the date of publishing the report
(mentioned on the website), employees and/or associates of Kalkine Pty Ltd do not hold positions in any of the
stocks covered on the website. These stocks can change any time and readers of the reports should not consider
these stocks as advice or recommendations.
Copyright 2021 Kalkine Pty Ltd. All rights
reserved. No part of this website, or its content, may be reproduced in any form without the prior consent of
Kalkine Pty Ltd.
 Please wait processing your request...