
 CA
 NZ
 UK
 US
 IND

 AU

 Share
 X (Formerly Twitter)
 Whatsapp
 Facebook
 LinkedIn
 Telegram
 Email This Article
 Copy Link
 Summarize with AI
 Chat GPT
 Perplexity

Highlights
- Spark New Zealand reported FY25 operating revenue of AUD 3,725 million and net earnings of AUD 252.0 million.
- The company entered a financing partnership involving approximately AUD 240 million in receivables linked to interest-free payment plans.
- FY26 guidance was reaffirmed with adjusted EBITDA targeted between AUD 1.01 billion and AUD 1.07 billion.
Spark New Zealand Ltd (ASX: SPK), a telecommunications and digital services provider operating across mobile, broadband, IT, media, and data centre services reported lower revenue and earnings for the 12 months ended June 2025 (FY25), alongside announcing a new financing partnership and reaffirming its FY26 outlook during its annual general meeting.
FY25 Financial Performance Overview
For the 12-month period ended June 2025, the company reported operating revenues and other gains of AUD 3,725 million, compared with AUD 3,820 million in FY24. This represented a decline of 2.5% year-on-year. Net earnings from continuing operations for FY25 stood at AUD 252.0 million, down from AUD 311.0 million in the prior year, translating into a year-on-year decrease of 19.0%.
According to the company, mobile service revenue declined during the period, influenced by lower customer spending and ongoing changes across certain markets. Consumer prepaid services and enterprise and government segments were among the areas affected during the financial year.
Business Update
In a key business development dated 22 December 2025, the company announced a partnership with Challenger Limited to establish a new financing structure linked to its interest-free payment plans. Under this arrangement, the company plans to sell approximately AUD 240 million of eligible interest-free payment receivables to Challenger.
The initiative is aimed at reducing working capital requirements and net debt while supporting continued mobile customer activity. The partnership structure also enables the ongoing sale of future receivables, improving capital efficiency without altering Spark’s customer experience or its control over credit processes, collections, or device supply.
FY26 Outlook and Strategic Direction
During its annual general meeting held on 7 November 2025, the company reaffirmed its FY26 guidance. The company is targeting adjusted EBITDA in the range of AUD 1.01 billion to AUD 1.07 billion, assuming completion of the data centre sale by December 2025 and excluding any disposal gains.
Capital expenditure before spectrum allocation is expected to range between AUD 380 million and AUD 410 million, with an additional AUD 50 million to AUD 70 million earmarked for strategic data centre investment. Free cash flow for FY26 is forecast at AUD 290 million to AUD 330 million, with the full amount expected to be distributed to shareholders through dividends.
Spark also highlighted its five-year “SPK-30” strategy, which focuses on its core connectivity business, disciplined capital allocation, partnerships, and increased use of artificial intelligence to support a scalable operating model.
Share Performance of SPK
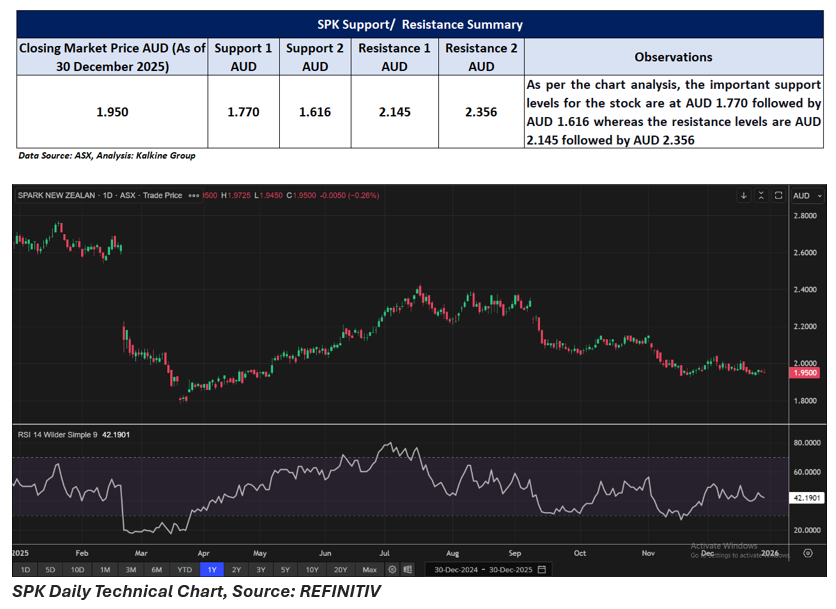
SPK shares edged down 0.26% intraday to close at AUD 1.950 per share on 30 December 2025. On a one-year basis, the stock has declined by 26.42%, with year-to-date losses widening to 27.51%. Performance over shorter periods remained mixed, with the stock down 2.01% over the past month, 5.34% over three months, and 14.47% over six months, while it posted a gain of 3.17% over nine months.
SPK’s 52-week high stands at AUD 2.770, recorded on 21 January 2025, while the 52-week low of AUD 1.780 was reached on 20 March 2025.
Support and Resistance Summary
Note 1: Past performance is neither an Indicator nor a guarantee of future performance.
Note 2: The reference date for all price data, and currency, is 30 December 2025. The reference data in this report has been partly sourced from EODHD/Others.
Technical Indicators Defined:
Support: A level at which the stock prices tend to find support if they are falling, and a downtrend may take a pause backed by demand or buying interest. Support 1 refers to the nearby support level for the stock and if the price breaches the level, then Support 2 may act as the crucial support level for the stock.
Resistance: A level at which the stock prices tend to find resistance when they are rising, and an uptrend may take a pause due to profit booking or selling interest. Resistance 1 refers to the nearby resistance level for the stock and if the price surpasses the level, then Resistance 2 may act as the crucial resistance level for the stock.


 Nov 12, 2026





 Please wait processing your request...