
 CA
 NZ
 UK
 US
 IND

 AU

 Share
 X (Formerly Twitter)
 Whatsapp
 Facebook
 LinkedIn
 Telegram
 Email This Article
 Copy Link
 Summarize with AI
 Chat GPT
 Perplexity

Key highlights
- Santos maintained a robust free cash flow of US$1.8 billion for FY2025.
- The company achieved its lowest unit production costs in a decade.
- Major growth projects are on track for first production in 2026.
- Santos reached its 2030 emissions reduction targets five years.
While Santos's FY25 results demonstrate operational resilience and robust cash flow, the primary focus now shifts to the execution of its 2026 growth phase. We will evaluate whether this fundamental strength is reflected in the current price action from a technical perspective.
Resilient Margins Amid Softer Market Conditions
- Santos (ASX:STO) remains a dominant Asia-Pacific energy producer, currently entering a transformative phase as its major growth projects, Barossa LNG and Alaska’s Pikka oil project, approaches first production in early 2026. Despite a 30% dip in underlying NPAT to US$898 million for FY2025 due to softer commodity prices, the company maintained a robust free cash flow of US$1.8 billion and achieved its lowest unit production costs in a decade at $6.78 per boe.
- Management has provided a steady production guidance of 101 to 111 mmboe for 2026, supported by a healthy balance sheet with a net debt/EBITDA ratio of approximately 1.5x.
- Additionally, Santos is positioning itself as a leader in decarbonization, having reached its 2030 emissions reduction targets five years early via the Moomba CCS project.
Associated Risks
- Santos Limited (ASX: STO) faces several multi-layered risks as it enters its 2026 growth phase. A central concern remains its heavy exposure to "big-ticket" projects, specifically Barossa LNG and the Pikka oil project, where any technical delays or inflationary cost blowouts could significantly dent investor confidence and cycle-sensitive returns.
- Geopolitical volatility also presents a double-edged sword; while recent Middle East escalations have spiked oil prices, any sudden de-escalation or a global supply surplus could rapidly unwind these premiums.
- Furthermore, as a major fossil fuel producer, Santos must navigate intensifying ESG and regulatory headwinds, including the pressure to substantiate its net-zero roadmap and managing the inherent uncertainties of emerging technologies like carbon capture and storage (CCS).
Technical Outlook
Santos (ASX: STO)
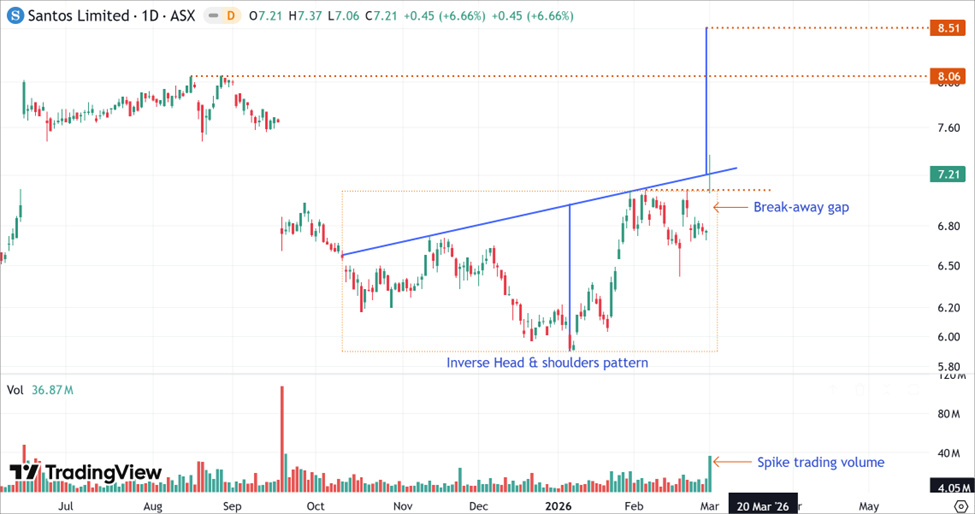
STO’s Daily Price Chart (at the closing price of 27th February 2026). Powered by: tradingview.com
- On the daily chart, STO’s stock price is forming an Inverse Head and Shoulders pattern, indicating a positive bias.
- While the breakout is not yet confirmed, the breakaway gap and volume surge on March 2nd suggest significant bullish accumulation below the neckline.
- A successful breach of this level projects a target of $8.51, though investors should anticipate a healthy pullback near its previous peaks of $8.06 before this objective is fully realized.
Bottom Line
- Santos Limited is entering a critical transition period where its operational resilience meets a major growth inflection point. The company’s fundamental strength, characterized by robust free cash flow of US$1.8 billion and decade-low production costs, provides a solid cushion against current commodity price volatility.
- Technically, the emergence of an Inverse Head and Shoulders pattern and a recent breakaway gap suggest that the market is beginning to price in the successful execution of the Barossa and Pikka projects. While a short-term price target of $8.51 is projected, the path upward will likely involve a pullback near the $8.06 resistance level, requiring investors to balance the bullish technical setup against execution risks and geopolitical uncertainties.


 Nov 12, 2026





 Please wait processing your request...