
 CA
 NZ
 UK
 US
 IND

 AU

 Share
 X (Formerly Twitter)
 Whatsapp
 Facebook
 LinkedIn
 Telegram
 Email This Article
 Copy Link
 Summarize with AI
 Chat GPT
 Perplexity

Key Highlights
- Santos is a major Australian Natural Gas and LNG producer, with operations spanning Australia and Papua New Guinea and a portfolio supported by projects including Barossa and Pikka.
- Q2 2026 delivered stronger operating performance, with production increasing 3% to 23.1 million barrels of oil equivalent and sales Revenue rising 6% to $1.349 billion.
- Barossa is approaching planned production levels, operating at approximately 97% of planned rates in the latest quarterly update, while Pikka Phase 1 continues progressing toward plateau production.
- Technically, STO has developed a potential Inverse Head & Shoulders pattern following its recovery from the June 2026 low, with the share price now testing neckline and descending Trendline resistance around $8.06.
- A decisive breakout above $8.06 would strengthen the bullish Reversal setup and could generate a medium-term measured-move target near $9.23, based on the pattern shown on the chart.
- The next major catalyst is Santos' 2026 half-year results, scheduled for 19 August 2026.
Following a period of consolidation, Santos Limited (ASX: STO) appears to be approaching an important technical inflection point. The Daily Chart shows a potential Inverse Head & Shoulders structure developing after the stock declined toward approximately $7.00 in June 2026. STO subsequently recovered and has returned to the $8.00 area, where it is now testing a key horizontal resistance level and a descending trendline. A convincing breakout above this resistance zone could signal the beginning of a new medium-term recovery phase.
The LNG and Gas Growth Story
Santos is one of Australia's major oil and gas producers, with its Investment case increasingly supported by LNG and gas production from major projects. The company's latest operating update showed improving production and revenue momentum.
- Higher Production: Santos produced 23.1 million barrels of oil equivalent in Q2 2026, representing a 3% increase from the previous quarter.
- Improving Revenue: Sales revenue increased 6% quarter-on-quarter to $1.349 billion, reflecting stronger operating performance.
- Barossa Progress: The Barossa project was reported to be producing at approximately 97% of planned rates, an important milestone as the project moves toward steady-state production.
- Pikka Development: Pikka Phase 1 continues to progress toward plateau production, providing another potential source of production growth.
- Strong Cash Generation: Santos reported approximately $378 million of free Cash Flow from operations for the first half of 2026.
- Gas Sales Agreement: The company also executed a 10-year gas sales agreement with the South Australian Government, supporting the longer-term outlook for its domestic gas business.
Associated Risks
While the technical structure has improved, several risks remain.
The potential Inverse Head & Shoulders pattern remains unconfirmed. STO must deliver a sustained breakout above the $8.09 neckline and descending trendline before the bullish scenario can be validated. Failure to overcome this resistance could result in another period of consolidation or a pullback toward the right-shoulder area around $7.40–$7.60, with the June low near $7.00 providing a more important support reference.
Santos also remains exposed to movements in global oil and LNG prices. Commodity-price Volatility can materially affect realised prices, revenue and cash flow. Recent market commentary has highlighted significant volatility in oil prices during 2026, reinforcing the sensitivity of energy stocks to changing Supply and geopolitical conditions.
Project execution also remains important. Santos is continuing to ramp up major projects, and delays, commissioning issues or weaker-than-expected production could affect the anticipated improvement in operating performance.
Technical Outlook
STO's daily chart is approaching an important technical inflection point as a potential Inverse Head & Shoulders pattern moves toward confirmation.
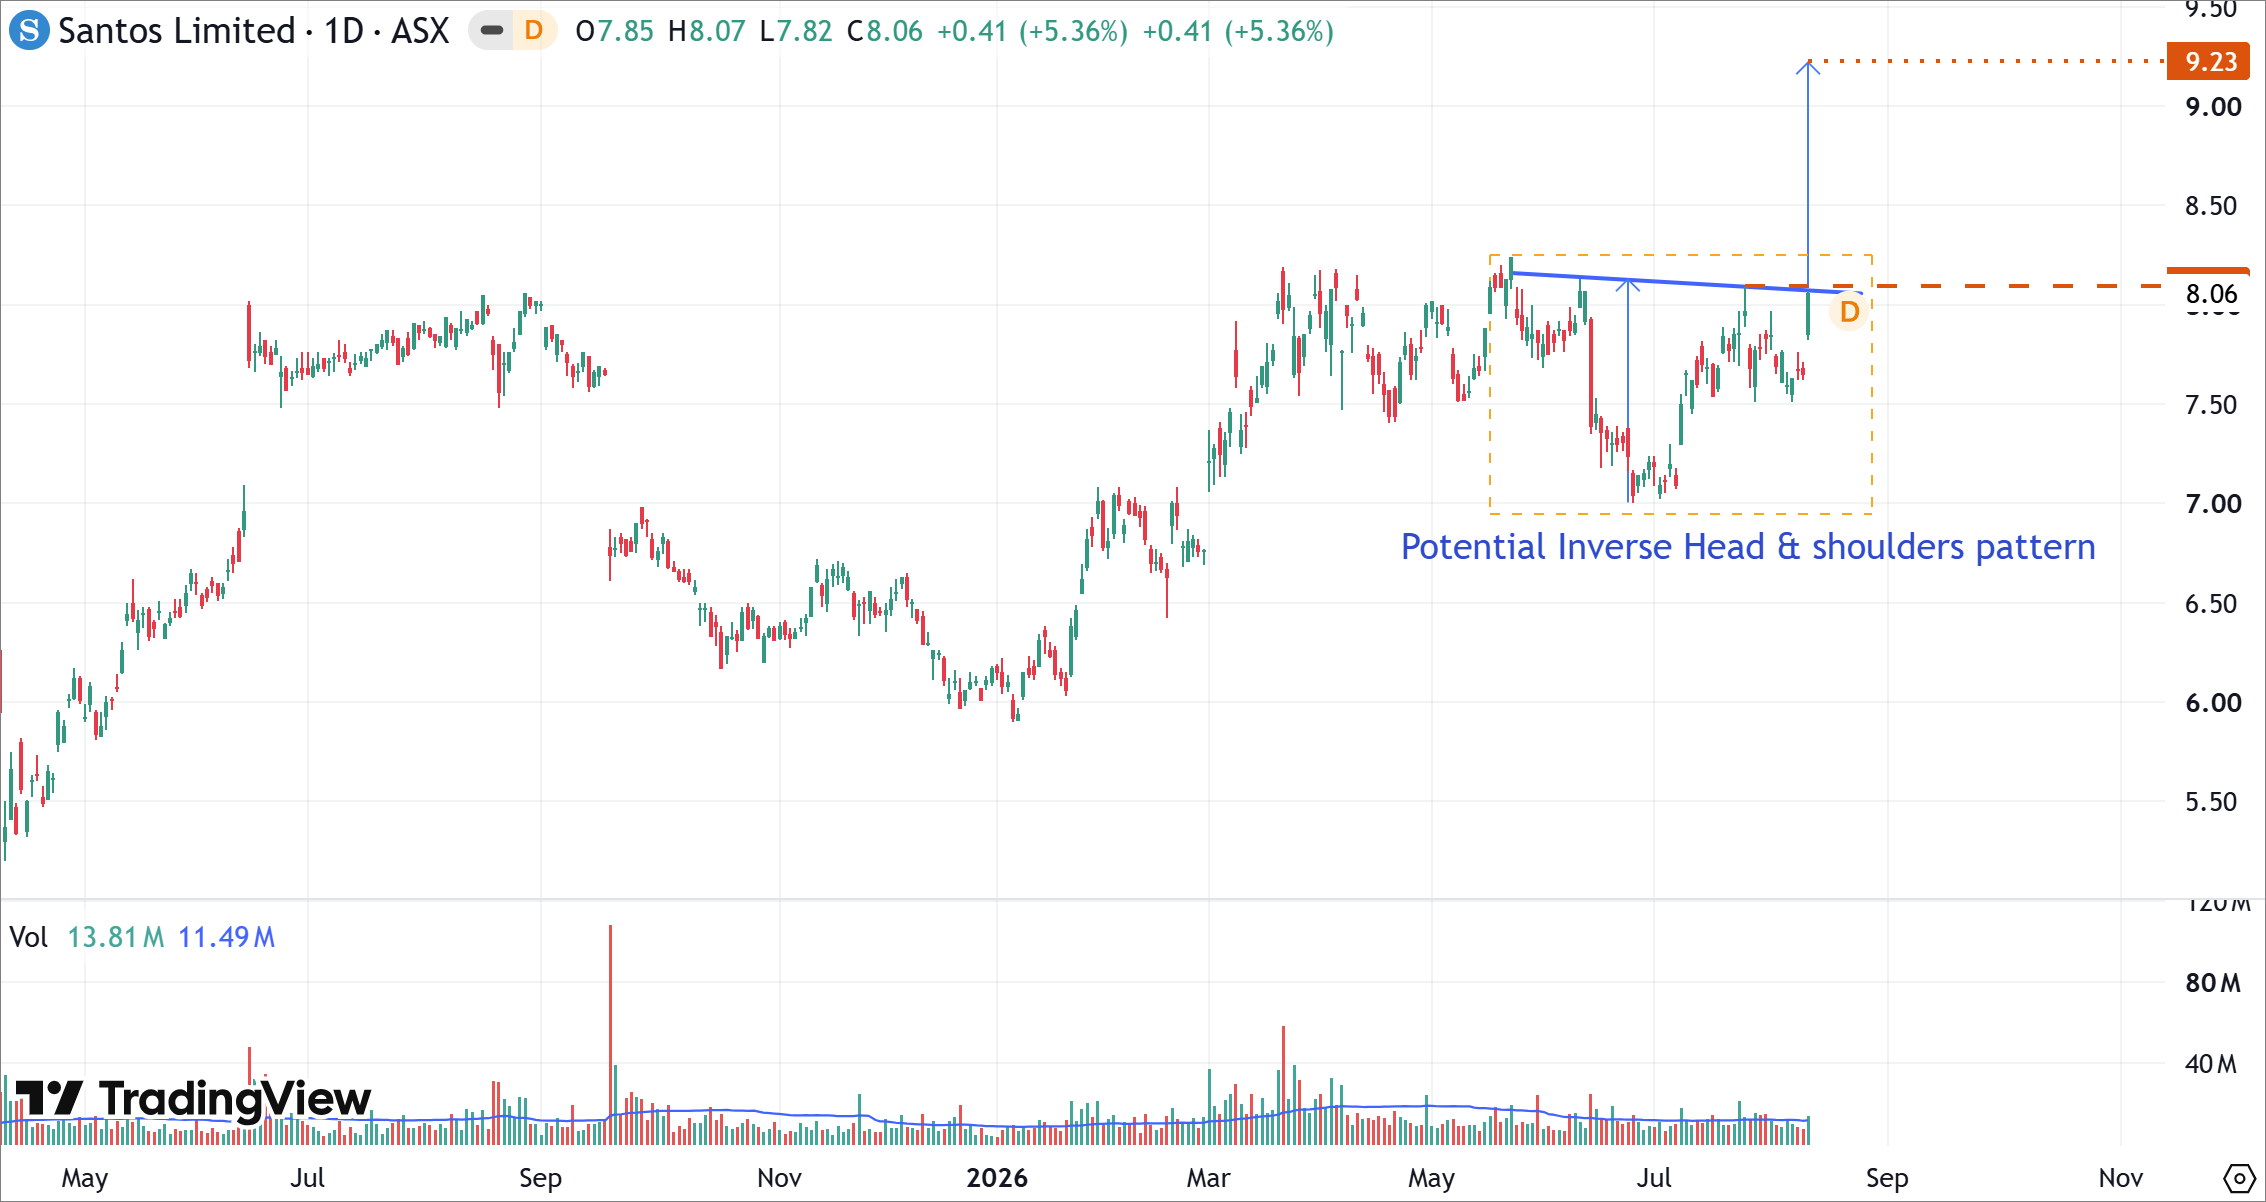
STO's Daily Price Chart (at the closing price of 11/08/2026). Powered by: tradingview.com.
- STO has developed a potential Inverse Head & Shoulders pattern following the decline from its earlier 2026 highs. This suggests that bearish momentum may have weakened and buyers have gradually regained control.
- The neckline is positioned around $8.09. A sustained close above $8.09 would strengthen the bullish technical outlook and confirm the potential Inverse Head & Shoulders pattern. Ideally, the breakout would be accompanied by increased trading Volume to provide additional confirmation.
- The measured-move projection shown on the chart points toward approximately $9.23. This represents potential upside of around 14.5% from the $8.06 neckline level if the pattern is confirmed.
- Failure at $8.09 could trigger further consolidation. In that scenario, the right-shoulder region around $7.40–$7.50 would become an important near-term support area, followed by the broader $7.00 region.
Bottom Line
Santos' improving production profile and progress across its major LNG and oil projects provide a supportive fundamental backdrop, with the upcoming 2026 half-year results on 19 August representing an important near-term catalyst.
Technically, STO is approaching the key $8.09 neckline of a potential Inverse Head & Shoulders pattern. A decisive breakout could confirm the bullish reversal and target $9.23, while failure at resistance could lead to consolidation toward the $7.40–$7.50 support area.


 Nov 12, 2026





 Please wait processing your request...