
 CA
 NZ
 UK
 US
 IND

 AU

 Share
 X (Formerly Twitter)
 Whatsapp
 Facebook
 LinkedIn
 Telegram
 Email This Article
 Copy Link
 Summarize with AI
 Chat GPT
 Perplexity

Key Highlights
- Region Group continues to benefit from its defensive exposure to convenience-based retail assets, supported by resilient tenant demand and recurring rental income.
- The REIT maintains a stable income profile and diversified property portfolio, helping to underpin investor confidence during a period of broader market volatility.
- The technical picture has improved materially, with the daily chart forming an inverse head-and-shoulders accumulation pattern beneath a descending trendline resistance.
While Region Group Holdings Limited (ASX:RGN) spent much of the past year consolidating within a broad trading range, the recent price action suggests that downside momentum has substantially faded. The stock has established a series of higher lows and is now testing a key confluence resistance zone, raising the possibility that the corrective phase may be transitioning into a new accumulation cycle.
The REIT’s defensive retail property exposure, combined with improving technical structure, positions RGN as a stock worth monitoring for a potential breakout continuation.
The Defensive Retail Income Thesis
Region Group’s investment case remains anchored in the stability of its convenience-oriented retail portfolio and recurring rental income streams.
- Convenience-Based Asset Exposure: The portfolio is weighted toward neighborhood and convenience retail assets that tend to exhibit more resilient foot traffic than discretionary retail categories, helping to support occupancy and rental collections through varying economic conditions.
- Diversified Tenant Base: The REIT benefits from exposure across multiple tenant categories, reducing dependence on any single retailer and helping to stabilize cash flows across the portfolio.
- Income Stability: As a property trust, RGN continues to appeal to income-focused investors seeking exposure to recurring distributions backed by physical retail assets and long-term leasing arrangements.
Associated Risks
Despite its defensive characteristics, Region Group remains exposed to several macroeconomic and sector-specific risks.
A prolonged period of elevated interest rates could pressure property valuations and increase financing costs across the REIT sector. Additionally, weaker consumer spending or retailer insolvencies could affect tenant demand and leasing conditions. Market sentiment toward listed property trusts can also remain sensitive to bond yield movements, which may influence valuation multiples independently of underlying property performance.
Technical Outlook
The daily chart for Region Group highlights a textbook bullish reversal following the completion of a multi-month accumulation phase. The stock has successfully carved out an inverse head-and-shoulders pattern and has now broken above its descending neckline resistance, confirming a transition from consolidation to a new upward trend.
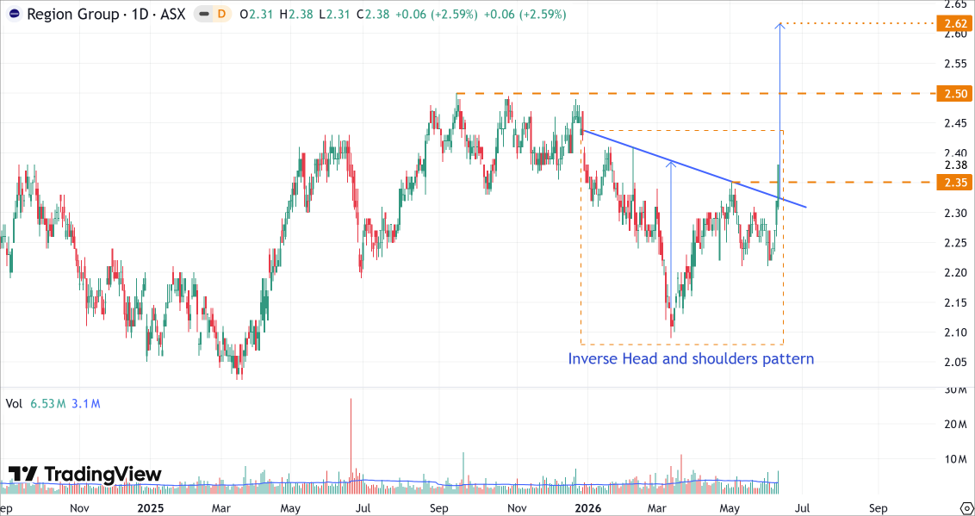
RGN's Daily Price Chart (at the closing price of 11/06/2026). Powered by: tradingview.com
- On the daily chart, RGN's stock price has methodically completed an Inverse Head and Shoulders pattern, signalling the exhaustion of the prior corrective phase and the emergence of a bullish reversal.
- The critical technical trigger has already occurred. Price action has successfully broken above the descending neckline resistance near $2.35, validating the pattern and confirming a structural shift in favour of buyers.
- With the reversal pattern confirmed, the primary path of least resistance appears to be higher. The first upside target is located near $2.50, representing a significant historical resistance area.
- Should buyers successfully overcome the $2.50 barrier, the measured-move projection from the inverse head-and-shoulders pattern suggests a potential advance towards $2.62.
Bottom Line
Region Group (ASX:RGN) presents an attractive combination of defensive retail property exposure, stable recurring income, and increasingly constructive technical momentum. The recent completion and confirmation of an inverse head-and-shoulders pattern marks a significant improvement in the stock's technical profile, suggesting that institutional accumulation may be transitioning into a new markup phase. Having already broken above the critical $2.35 neckline, RGN appears well-positioned to challenge intermediate resistance at $2.50, with a successful breakout above that level potentially opening the door to the pattern's measured objective near $2.62. Investors should closely monitor whether the stock can maintain support above the newly established breakout zone, as this would reinforce the bullish reversal thesis.


 Nov 12, 2026





 Please wait processing your request...