
 CA
 NZ
 UK
 US
 IND

 AU

 Share
 X (Formerly Twitter)
 Whatsapp
 Facebook
 LinkedIn
 Telegram
 Email This Article
 Copy Link
 Summarize with AI
 Chat GPT
 Perplexity

Image source: © 2025 Krish Capital Pty. Ltd.
Highlights
- ORA’s FY25 revenue rose 24.4% YoY to AUD 2,090 million, supported by Saverglass and cans volume growth.
- Net debt reduced sharply to AUD 254.2 million in FY25, from AUD 1,753.5 million in FY24.
Orora Limited (ASX:ORA), an Australia-based global manufacturer and distributor of packaging and visual solutions, delivered encouraging results for the full year ended 30 June 2025 (FY25). Group revenue increased 24.4% YoY to AUD 2,090 million, while Group EBITDA rose 19.4% YoY to AUD 419 million in FY25. Net profit after tax (NPAT) for the period also improved by 18% yoy to AUD 151 million.
The yearly revenue growth was primarily driven by a full-year contribution from Saverglass, compared to seven months in the prior year, as well as higher beverage can volumes. The company also completed its portfolio transformation in FY25.
Balance Sheet Transformation
Orora significantly enhanced its financial position in FY25. Proceeds from the divestment of its OPS business contributed to a substantial reduction in net debt, which fell to AUD 254.2 million as of 30 June 2025, compared to AUD 1,753.5 million in the prior corresponding period.
Outlook and Industry Trends
The company expects YoY EBITDA growth from its key divisions — Cans, Saverglass, and Gawler — underpinned by steady volume growth, cost efficiencies, and operational gains from Gawler’s two-furnace setup. However, EBIT growth in FY26 is expected to be more measured due to higher depreciation and added corporate costs following the OPS sale.
From an industry perspective, the global packaging sector is positioned for steady long-term growth, with rising demand for sustainable, lightweight, and recyclable packaging solutions across cans, glass, and specialty segments. Demand from beverage and premium wine markets is expected to remain robust. Nonetheless, challenges such as currency fluctuations, energy prices, and tariffs, especially in the US, could weigh on margins.
Share performance of ORA
ORA shares ended the session at AUD 2.010, per share, share down 1.95% intraday on 09 September 2025. In a year, ORA’s share price has dropped by 22.99% and is down 18.29% year-to-date. On a quarterly basis, however, it has increased by 6.35%. Over the past week and month, ORA declined 5.19%, while over three months it gained 6.91%. Month-to-date, ORA has dropped 3.37%, and week-to-date it is down 2.43%. The stock’s 52-week high of AUD 2.740 was recorded on 30 September 2024, while the 52-week low of AUD 1.655 was reached on 7 April 2025.
Support and Resistance Summary
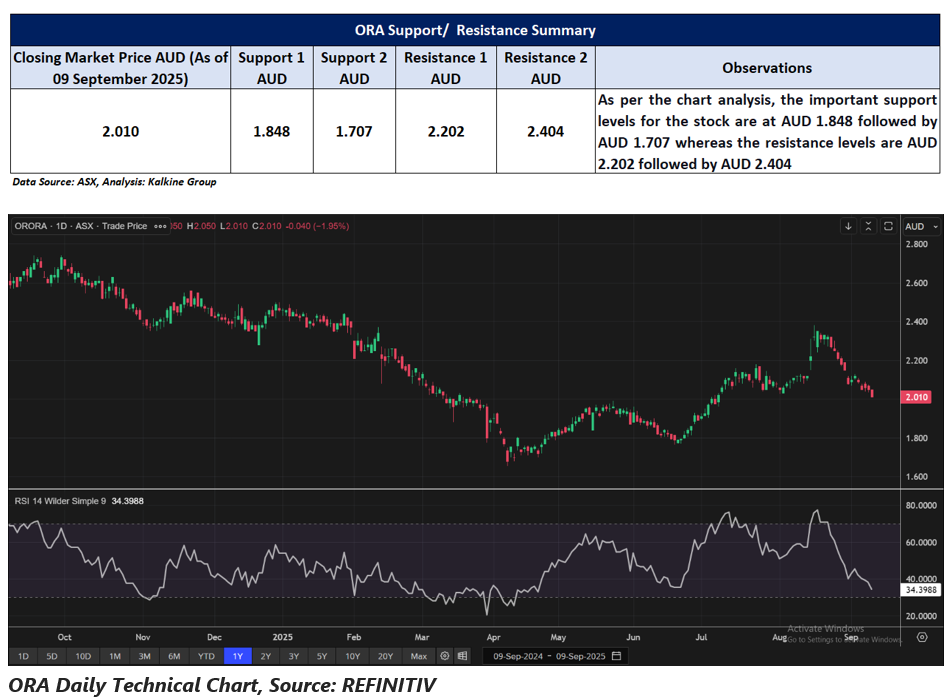
Note 1: Past performance is neither an Indicator nor a guarantee of future performance.
Note 2: The reference date for all price data, and currency, is 09 September 2025. The reference data in this report has been partly sourced from EODHD/Others.
Technical Indicators Defined:
Support: A level at which the stock prices tend to find support if they are falling, and a downtrend may take a pause backed by demand or buying interest. Support 1 refers to the nearby support level for the stock and if the price breaches the level, then Support 2 may act as the crucial support level for the stock.
Resistance: A level at which the stock prices tend to find resistance when they are rising, and an uptrend may take a pause due to profit booking or selling interest. Resistance 1 refers to the nearby resistance level for the stock and if the price surpasses the level, then Resistance 2 may act as the crucial resistance level for the stock.


 Nov 12, 2026





 Please wait processing your request...