
 CA
 NZ
 UK
 US
 IND

 AU

 Share
 X (Formerly Twitter)
 Whatsapp
 Facebook
 LinkedIn
 Telegram
 Email This Article
 Copy Link
 Summarize with AI
 Chat GPT
 Perplexity

Highlights
- In FY25, net income of JHX declined 17% YoY, affected by lower margins and AZEK merger-related costs.
- 1QFY26 sales of JHX reached USD 900 million exceeded guidance, supported by product demand.
- In FY26, the company projects EBITDA of USD 1.05–1.15 billion..
James Hardie Industries PLC (ASX:JHX) manufactures fiber cement and fiber gypsum products for residential and commercial construction worldwide. In the financial year 2025 (FY25), the company reported net sales of USD 3,877.5 million, down 1.0% from USD 3,936.3 million in FY24. The decline was due to reduced sales volumes in North America and the Asia-Pacific region, partly balanced by higher average selling prices across regions. Gross profit for the period dropped by 5% YoY to USD 1,505.0 million, with a 1.6 percentage point reduction in gross margin mainly resulting from lower performance in North America, while Asia-Pacific showed some improvement.
Net income for FY25 was USD 424.0 million, a 17.0% fall from the prior year, influenced by a 2.6 percentage point decrease in operating margin, lower gross margin, and merger-related costs linked to AZEK.
Business Update
In the first quarter of FY26 (Q1 FY26), the company reported net sales of USD 900 million, supported by higher average net sales prices across all regions. Operating income reached USD 139 million, while adjusted EBITDA stood at USD 226 million. The quarterly performance exceeded guidance, driven by mid-single-digit growth in deck, rail, and accessories sell-through. Integration initiatives are progressing as planned, with early realisation of cost synergies and faster-than-expected commercial synergy gains.
Key Positives and Negatives
The current ratio increased to 2.10x in FY25 from 1.79x in FY24, while the debt-to-equity ratio declined to 0.52x in FY25 from 0.61x in FY24. Gross margin decreased to 38.8% in FY25 from 40.4% in FY24, and operating margin fell to 16.9% in FY25 from 19.5% in FY24.
Business Outlook
In FY26, the company expects net sales from Siding & Trim to range between USD 2.675–2.850 billion and from Deck, Rail & Accessories between USD 775–800 million. Total adjusted EBITDA is projected at USD 1.05–1.15 billion, with free cash flow likely to exceed USD 200 million.
According to the data released by ABS, the Australian housing market is supported by higher residential dwellings, which may benefit JHX’s sales outlook.
The company’s capital investments aim to enhance production capacity. The AZEK acquisition may temporarily impact ROCE, long-term gains in EBIT growth and capital efficiency are anticipated.
Share Performance of JHX
On 07 October 2025, JHX shares traded at AUD 30.240 per share. Over the past year, the stock price has dropped 44.54%, while in the last six months it has decline by 10.21%. In the past three months, the stock price has declined 29.37%. The 52-week high for JHX was AUD 58.82, recorded on 26 November 2024, and the 52-week low was AUD 27.32, reached on 25 September 2025.
Support and Resistance Summary
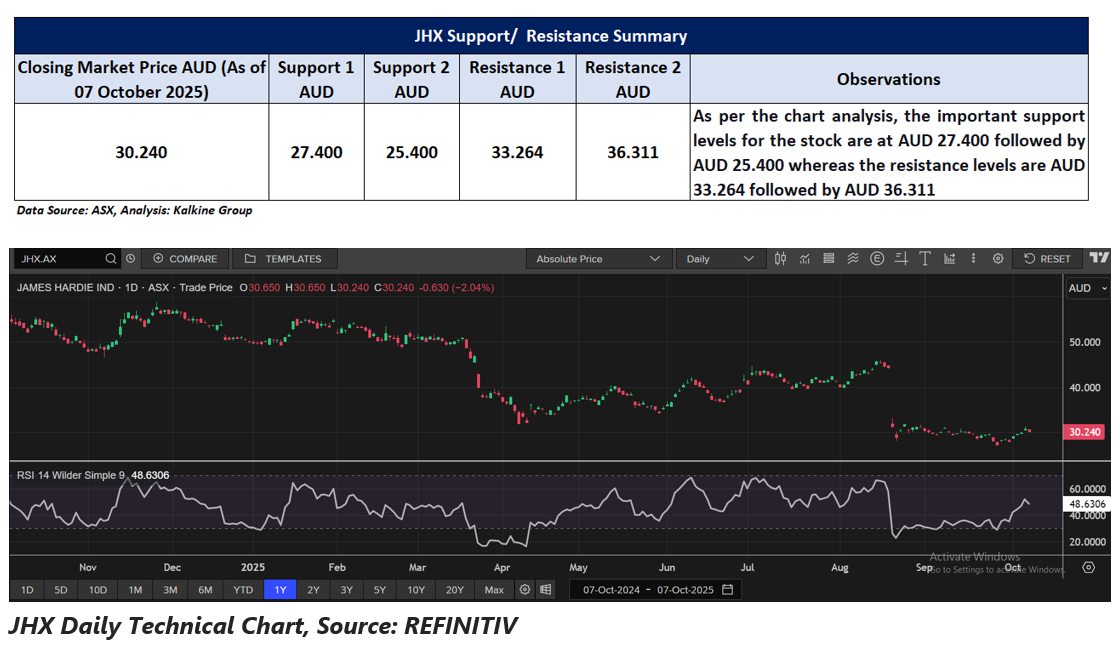
Note 1: Past performance is neither an Indicator nor a guarantee of future performance.
Note 2: The reference date for all price data, and currency, is 07 October 2025. The reference data in this report has been partly sourced from EODHD/Others.
Technical Indicators Defined:
Support: A level at which the stock prices tend to find support if they are falling, and a downtrend may take a pause backed by demand or buying interest. Support 1 refers to the nearby support level for the stock and if the price breaches the level, then Support 2 may act as the crucial support level for the stock.
Resistance: A level at which the stock prices tend to find resistance when they are rising, and an uptrend may take a pause due to profit booking or selling interest. Resistance 1 refers to the nearby resistance level for the stock and if the price surpasses the level, then Resistance 2 may act as the crucial resistance level for the stock.


 Nov 12, 2026





 Please wait processing your request...