…
James Hardie Industries plc engages in the manufacture and sale of fiber cement, fiber gypsum, and cement bonded boards in the United States, Australia, Europe, and New Zealand. It operates through four segments: Siding & Trim, Deck, Rail & Accessories, Australia & New Zealand, and Europe. The Siding & Trim segment manufactures fiber cement and PVC siding and trim products, mouldings, interior linings, and accessories under brands such as Hardie, AZEK Exteriors, and Versatex are used in both residential new construction and repair and remodel applications. The Deck, Rail & Accessories segment produces decking, railing, cladding, pergolas, cabanas, and related accessories, including wood-alternative decking and railing solutions offered under the TimberTech, ULTRALOX, and INTEX brands, as well as functional and decorative outdoor accessories, including drink rails, structural mounting posts, lighting systems and gate kits; and adjustable louvered pergola systems through StruXure. The Australia & New Zealand segment manufactures and sells fiber cement products for residential and commercial applications, including exterior cladding, interior wall linings, flooring, eaves and soffits, and façade systems, primarily under the Hardie brand. The Europe segment produces fiber gypsum products and cement-bonded boards under the fermacell brand, and fiber cement products under the Hardie brand, serving residential and commercial repair, remodel, and new construction markets. The company offers its products through a network of specialty building products distributors, lumberyards, and home improvement retailers to builder's merchants, remodelers, DIY stores, and professional contractors. James Hardie Industries plc was founded in 1888 and is headquartered in Dublin, Ireland.

Source: TradingView
The charts and visual representations are sourced from TradingView through embedded widgets. For any issues with chart display, please visit the TradingView website
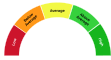
A unique technical analysis driven score developed by Kalkine showing momentum in stock prices based on select technical indicators identified.
James Hardie Industries plc manufactures and sells fiber-cement cladding, backerboard and other building materials for residential and commercial construction, with significant exposure to the U.S., Australia and other developed markets. Long-term growth drivers include housing construction and renovation demand, replacement share gains versus alternative claddings, product innovation and capacity expansion that may support scale and pricing. The company appears positioned to deliver relatively predictable cash flows through market share and operational focus.
Note: The summary and risk score provided above is created by AI and should not be construed as a recommendation of Kalkine.
| Breakdown | 2026-03-31 | 2025-03-31 | 2024-03-31 | 2023-03-31 | 2022-03-31 |
|---|---|---|---|---|---|
| Type | yearly | yearly | yearly | yearly | yearly |
| Date | 2026-03-31 | 2025-03-31 | 2024-03-31 | 2023-03-31 | 2022-03-31 |
| Income before tax | 206.70M | 645.40M | 754.80M | 723.50M | 643.10M |
| Net income | 104.00M | 424.00M | 510.20M | 512.00M | 459.10M |
| Selling general administrative | 946.40M | 596.20M | 602.20M | 494.00M | 461.20M |
| Gross profit | 1729.60M | 1505.00M | 1588.40M | 1312.00M | 1313.50M |
| Reconciled depreciation | 493.50M | 216.20M | 185.00M | 172.60M | 161.80M |
| Ebit | - | 686.40M | 791.20M | 797.50M | 815.10M |
| Ebitda | - | 902.60M | 976.20M | 970.10M | 976.90M |
| Depreciation and amortization | - | 216.20M | 185.00M | 172.60M | 161.80M |
| Operating income | 722.50M | 655.90M | 767.40M | 741.40M | 682.60M |
| Other operating expenses | - | 3221.60M | 3168.90M | 2998.70M | 2800.40M |
| Interest expense | 231.10M | 41.00M | 36.40M | 37.00M | 40.30M |
| Tax provision | 102.70M | 221.40M | 244.60M | 211.50M | 184.00M |
| Interest income | - | 30.70M | 21.10M | 6.30M | 1.00M |
| Net interest income | -231.10M | -10.30M | -15.30M | -30.70M | -39.30M |
| Income tax expense | - | 221.40M | 244.60M | 211.50M | 184.00M |
| Total revenue | 4835.80M | 3877.50M | 3936.30M | 3777.10M | 3614.70M |
| Total operating expenses | 4113.30M | 849.10M | 821.00M | 533.60M | 499.20M |
| Cost of revenue | 3106.20M | 2372.50M | 2347.90M | 2465.10M | 2301.20M |
| Total other income expense net | -284.70M | -10.50M | -12.60M | -24.20M | -131.90M |
| Net income from continuing ops | 104.00M | 424.00M | 510.20M | 512.00M | 459.10M |
| Net income applicable to common shares | - | 424.00M | 510.20M | 512.00M | 459.10M |
| Breakdown | 2026-03-31 | 2025-03-31 | 2024-03-31 | 2023-03-31 | 2022-03-31 |
|---|---|---|---|---|---|
| Type | yearly | yearly | yearly | yearly | yearly |
| Date | 2026-03-31 | 2025-03-31 | 2024-03-31 | 2023-03-31 | 2022-03-31 |
| Total assets | 13688.60M | - | 4912.60M | 4479.10M | 4243.20M |
| Intangible assets | 3340.10M | - | 149.20M | 155.20M | 162.80M |
| Other current assets | 116.50M | - | 69.80M | 42.80M | 3.20M |
| Total liab | 7263.10M | - | 3053.70M | 2867.70M | 2910.30M |
| Total stockholder equity | 6425.50M | - | 1858.90M | 1611.40M | 1332.90M |
| Other current liab | 168.00M | - | 142.70M | 159.80M | 162.30M |
| Common stock | - | - | - | 230.00M | 232.10M |
| Capital stock | 326.70M | - | 224.70M | 230.00M | 232.10M |
| Retained earnings | 1829.70M | - | 1446.00M | 1196.80M | 892.40M |
| Other liab | - | - | - | 1048.90M | 1198.50M |
| Good will | 4780.40M | - | 192.60M | 194.90M | 199.50M |
| Other assets | - | - | - | 1152.90M | 1239.80M |
| Cash | 269.20M | - | 365.00M | 113.00M | 125.00M |
| Cash and equivalents | - | - | - | - | 125.00M |
| Total current liabilities | 1157.40M | - | 797.70M | 697.30M | 769.90M |
| Current deferred revenue | - | - | - | 320.40M | 320.40M |
| Net debt | 4265.80M | - | 757.60M | 1027.40M | 830.50M |
| Short term debt | - | - | - | 18.90M | 13.60M |
| Short long term debt | 43.80M | - | 7.50M | - | - |
| Short long term debt total | - | - | - | 1140.40M | 955.50M |
| Other stockholder equity | - | - | - | -1426.80M | -1124.50M |
| Property plant equipment | - | - | - | 1901.00M | 1517.10M |
| Total current assets | 1826.80M | - | 1428.40M | 1075.10M | 1124.00M |
| Net tangible assets | - | - | - | 1261.30M | 970.60M |
| Net receivables | 441.00M | - | 312.70M | 361.60M | 406.30M |
| Long term debt | 4491.20M | - | 1115.10M | 1059.00M | 877.30M |
| Inventory | 635.70M | - | 337.80M | 344.20M | 279.70M |
| Accounts payable | 351.40M | - | 252.00M | 198.20M | 273.60M |
| Accumulated other comprehensive income | - | - | - | -53.30M | -22.00M |
| Non currrent assets other | 27.20M | - | 19.30M | 54.10M | 4.10M |
| Non current assets total | 11861.80M | - | 3484.20M | 3404.00M | 3119.20M |
| Capital lease obligations | 250.70M | - | 78.40M | 81.40M | 78.20M |
| Long term debt total | - | - | - | - | 878.80M |
| Breakdown | 2026-03-31 | 2025-03-31 | 2024-03-31 | 2023-03-31 | 2022-03-31 |
|---|---|---|---|---|---|
| Type | yearly | yearly | yearly | yearly | yearly |
| Date | 2026-03-31 | 2025-03-31 | 2024-03-31 | 2023-03-31 | 2022-03-31 |
| Investments | - | -446.70M | -470.50M | -660.10M | -348.20M |
| Change to liabilities | - | - | - | -63.20M | 136.70M |
| Total cashflows from investing activities | - | -446.70M | -470.50M | -660.10M | -348.20M |
| Net borrowings | 3406.60M | -8.70M | 67.00M | 188.50M | 39.00M |
| Total cash from financing activities | 3350.90M | -165.90M | -210.10M | -25.40M | -449.60M |
| Change to operating activities | - | - | - | -114.90M | -94.40M |
| Net income | 104.00M | 424.00M | 510.20M | 512.00M | 459.10M |
| Change in cash | -261.20M | 189.80M | 230.20M | -86.30M | -46.50M |
| Begin period cash flow | 605.60M | 415.80M | 185.60M | 271.90M | 318.40M |
| End period cash flow | 344.40M | 605.60M | 415.80M | 185.60M | 271.90M |
| Total cash from operating activities | 589.80M | 802.80M | 914.20M | 607.60M | 757.20M |
| Issuance of capital stock | 0.00M | 0.00M | 0.40M | 0.20M | 0.30M |
| Depreciation | 493.50M | 216.20M | 185.00M | 172.60M | 161.80M |
| Other cashflows from investing activities | - | -24.50M | -1.70M | -68.80M | -88.50M |
| Dividends paid | - | 0.00M | 0.00M | 129.60M | 484.00M |
| Change to inventory | -48.50M | -15.70M | 3.40M | -70.80M | -64.30M |
| Change to account receivables | -15.60M | -25.00M | -19.70M | 32.10M | -70.90M |
| Sale purchase of stock | -13.70M | -149.90M | -271.40M | -78.40M | -2.80M |
| Other cashflows from financing activities | - | -7.30M | -6.10M | 443.90M | 387.90M |
| Change to netincome | - | - | - | 134.30M | 229.00M |
| Capital expenditures | 390.00M | 422.20M | 449.30M | 599.80M | 259.70M |
| Change in working capital | -109.90M | -37.90M | 43.90M | -103.40M | 26.10M |
| Stock based compensation | 38.00M | 23.00M | 28.20M | 15.70M | 9.00M |
| Other non cash items | 108.30M | 115.40M | 112.30M | -37.70M | 51.40M |
| Free cash flow | 199.80M | 380.60M | 464.90M | 7.80M | 497.50M |
Sector: Basic Materials Industry: Building Materials
|
Stock Name
|
Change
(AUD) |
Price
(AUD) |
Trailing
PE (x) |
Forward
PE (x) |
Price Sales
TTM (x) |
Price to Book Value (x)
|
Enterprise Value
to Revenue (x) |
Enterprise Value
to EBITDA (x) |
|---|---|---|---|---|---|---|---|---|
| JHX James Hardie Industries Plc |
0.02 0.05% |
37.00 | 119.32 | 21.88 | 3.97 | 2.39 | 3.66 | 17.46 |
| FBU Fletcher Building Ltd |
-0.03 1.05% |
2.84 | 19.33 | 17.18 | 0.52 | 0.98 | 0.96 | 9.38 |
| WGN Wagners Holding Company Ltd |
-0.10 2.36% |
4.13 | 21.35 | 8.16 | 1.69 | 4.05 | 2.00 | 12.02 |
| BMH Baumart Holdings Ltd |
- -% |
0.01 | - | - | 1.71 | 3.39 | 2.11 | 9.25 |
James Hardie Industries plc engages in the manufacture and sale of fiber cement, fiber gypsum, and cement bonded boards in the United States, Australia, Europe, and New Zealand. It operates through four segments: Siding & Trim, Deck, Rail & Accessories, Australia & New Zealand, and Europe. The Siding & Trim segment manufactures fiber cement and PVC siding and trim products, mouldings, interior linings, and accessories under brands such as Hardie, AZEK Exteriors, and Versatex are used in both residential new construction and repair and remodel applications. The Deck, Rail & Accessories segment produces decking, railing, cladding, pergolas, cabanas, and related accessories, including wood-alternative decking and railing solutions offered under the TimberTech, ULTRALOX, and INTEX brands, as well as functional and decorative outdoor accessories, including drink rails, structural mounting posts, lighting systems and gate kits; and adjustable louvered pergola systems through StruXure. The Australia & New Zealand segment manufactures and sells fiber cement products for residential and commercial applications, including exterior cladding, interior wall linings, flooring, eaves and soffits, and façade systems, primarily under the Hardie brand. The Europe segment produces fiber gypsum products and cement-bonded boards under the fermacell brand, and fiber cement products under the Hardie brand, serving residential and commercial repair, remodel, and new construction markets. The company offers its products through a network of specialty building products distributors, lumberyards, and home improvement retailers to builder's merchants, remodelers, DIY stores, and professional contractors. James Hardie Industries plc was founded in 1888 and is headquartered in Dublin, Ireland.
| Name | Title | Year Born |
|---|---|---|
| Mr. Jason Miele BA | Chief Financial Officer | 1977 |
| Mr. Ryan Kilcullen B.Sc., BSc, M.Sc., MS | Exec. VP of Global Operations | 1981 |
| Mr. Joseph C. Blasko BSFS, J.D. | Gen. Counsel, Chief Compliance Officer & Company Sec. | 1967 |
| Mr. Sean Gadd B.E., BEng, M.B.A., MBA | Pres of North America | 1973 |
| Mr. Aaron M. Erter | CEO & Exec. Director | 1974 |
| Dr. Joe Liu | Chief Technology Officer | 1963 |
| Mr. James Johnson II | VP & Chief Information Officer | 1972 |
| Mr. James Brennan-Chong | Director of Investor Relations & Market Intelligence | NA |
| Mr. Marc Setty | Head of Marketing ? North America | NA |
| Mr. Sami Rahman | Head of Product Management | NA |
Disclaimer - (*)This information, including any data, is sourced from Unicorn Data Services SAS, trading as EOD Historical Data (“EODHD”) on an ‘as is’ basis, using their API. We cannot guarantee the completeness or validity of the information and data provided on this page, as well as via the API. In some cases, the data may include analyst ratings or recommendations sourced through the EODHD API, which are intended solely for general information purposes.
This information does not consider your personal objectives, financial situation, or needs. Kalkine is not liable for any errors or omissions in the information provided or for any actions taken in reliance on it. You should seek advice from a financial adviser, stockbroker or other professional adviser (including taxation and legal advice) as necessary before acting on this information.