
 CA
 NZ
 UK
 US
 IND

 AU

 Share
 X (Formerly Twitter)
 Whatsapp
 Facebook
 LinkedIn
 Telegram
 Email This Article
 Copy Link
 Summarize with AI
 Chat GPT
 Perplexity

Image source: Shutterstock
Highlights
- The S&P/ASX 200 saw a significant surge on Tuesday, climbing 2.27% to close at 7,510.00
- Of the 200 stocks in the ASX 200 index, 174 ended the day in positive territory, while nine remained flat and 17 closed with losses
The S&P/ASX200 closed sharply higher on Tuesday, rising 166.70 points or 2.27% to 7,510.00, after hitting a new 52-week low on Monday after China retaliated against US tariffs. Today’s gains in the Australian equity benchmark were supported by broad-based buying across the sector, with all 11 underlying sectors settling in the positive zone. Out of the 200 underlying stocks of the ASX 200 index, 174 stocks closed with gains, while nine were unchanged, and 17 stocks settled with losses. Although many stocks tried to recover today from the recent selloff, few stocks seem to be showing weakness on the technical chart and may witness further correction. Let’s delve deeper into these five ASX-listed stocks.
Bluescope Steel Ltd (ASX: BSL)
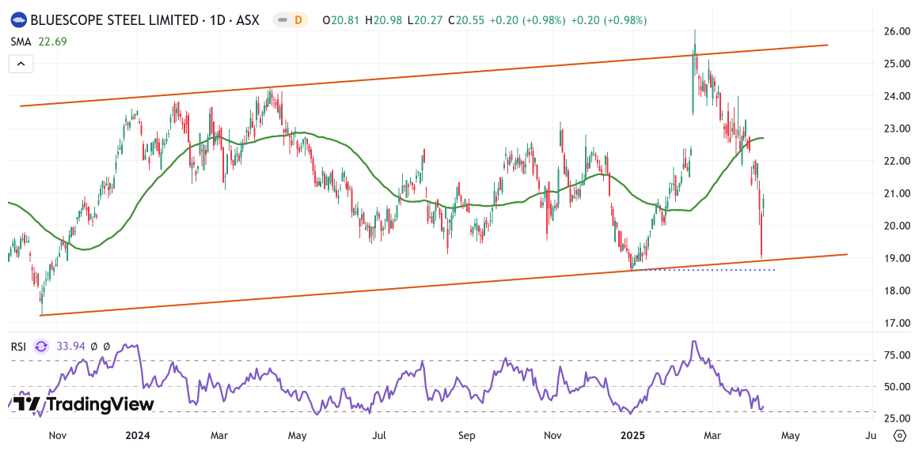
BlueScope Steel, a global player in steel supply and manufacturing, closed nearly 1% higher today at AUD 20.55. Despite today’s gains, the stock is down around 6.25% in the past five days and 12.33% in the last month.
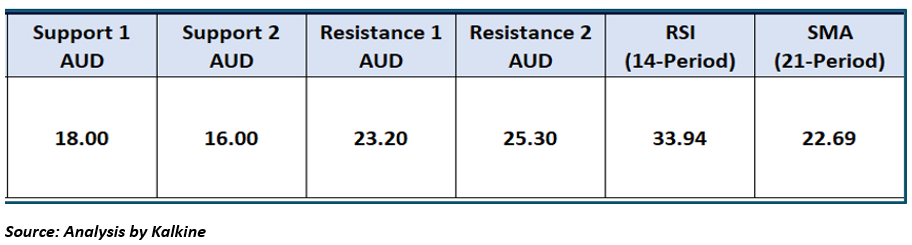
On the daily chart, BSL trades below a critical horizontal resistance and downward trendline, indicating the likelihood of continued bearish momentum. The Relative Strength Index (RSI) stands at 33.94, signaling increased selling pressure. Additionally, the price remains below key Simple Moving Averages (SMA), further reinforcing the weak trend. Leading indicators also reflect ongoing weakness, suggesting that the stock may face further downside unless strong support emerges soon.
QBE Insurance Group Ltd (ASX: QBE)
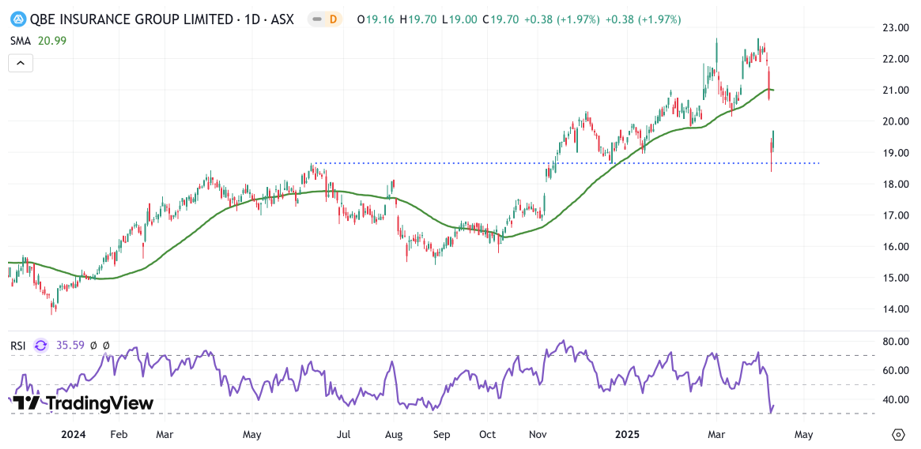
QBE Insurance, an insurance provider, closed 1.97% higher today at AUD 20.55. The stock is down 11.86% in the past five days and 6.37% in the past one month.
On the daily chart, QBE has seen a sharp decline and is now trading below a key horizontal support level and an upward trend line, highlighting sustained bearish momentum. The Relative Strength Index (RSI) at 35.59 indicates rising selling pressure. The stock also remains below major Simple Moving Averages (SMA), reinforcing the downtrend. With leading indicators pointing to continued weakness, further downside is possible unless a strong support base develops in upcoming sessions.

Qantas Airways Limited (ASX: QAN)
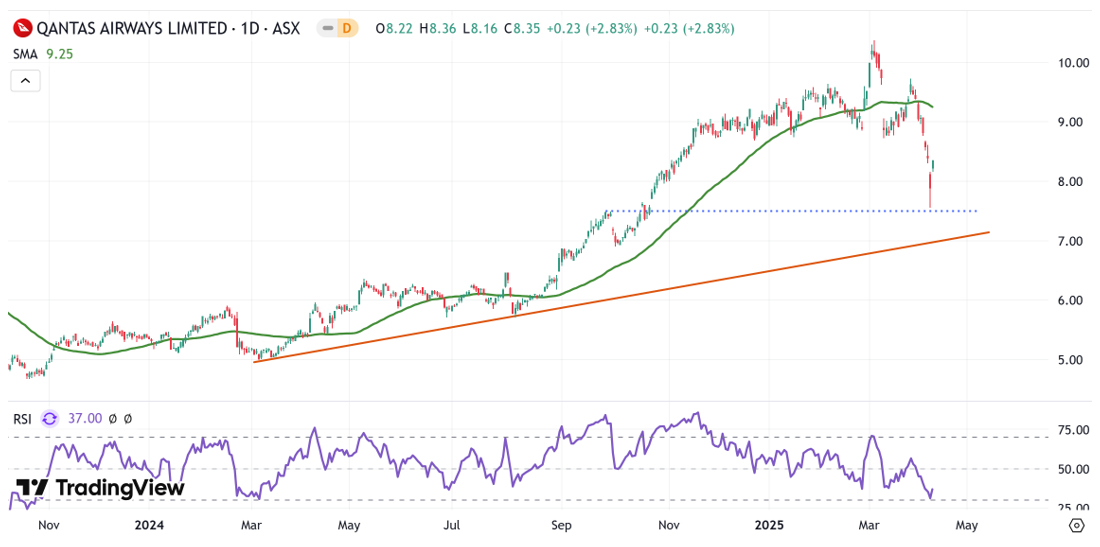
Shares of Australia’s leading domestic and international airline, Qantas Airways, closed today at AUD 8.35 with a gain of 2.83%. The stock is down 7.94% in the past five days and has shed around 14.27% in the past month.
On the daily chart, QAN is trading below key horizontal support and a breached upward trendline, signalling persistent bearish momentum. The RSI stands at 37.00, reflecting increasing selling pressure. Current price of the stock remains below the 50-period Simple Moving Average (SMA), further supporting the ongoing downtrend. Weakness in leading indicators suggests limited buying interest, and unless a solid support level holds, the stock may face continued downside in the near term.

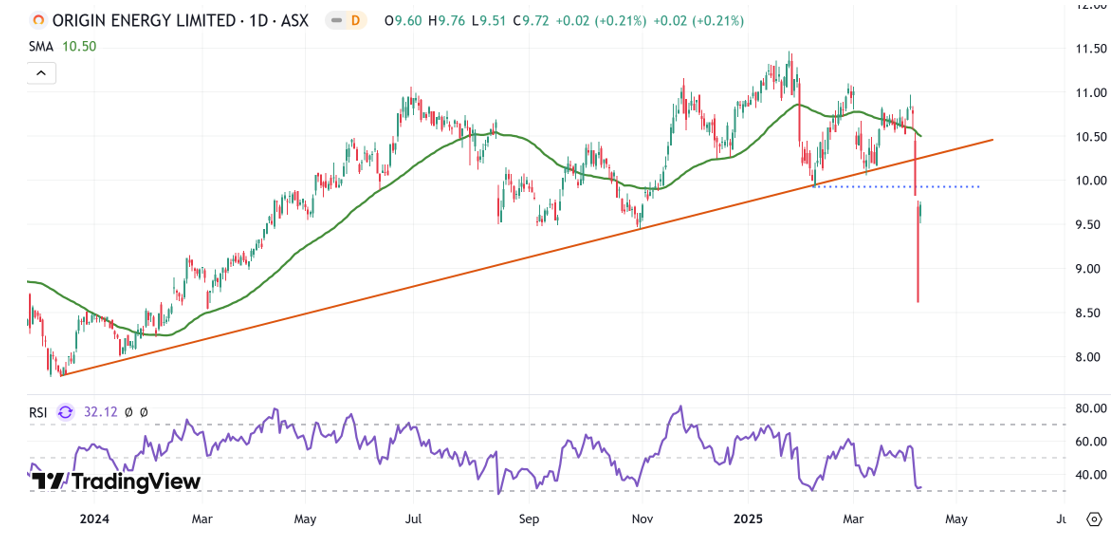
Origin Energy Limited (ASX: ORG)
Shares of Origin Energy, an integrated energy company, closed today at AUD 9.72. The stock price has depreciated by around 10.17% in the past five days and is down around 5% in the past month.
On the daily chart, ORG has declined sharply from recent highs and is currently trading below a key horizontal support level, indicating sustained bearish momentum. The RSI is at 32.32, highlighting growing selling pressure. The stock continues to trade below the 50-period Simple Moving Average (SMA), reinforcing the prevailing downtrend. Leading indicators show ongoing weakness, and unless the stock finds support soon, the possibility of further downside remains high in the near term.

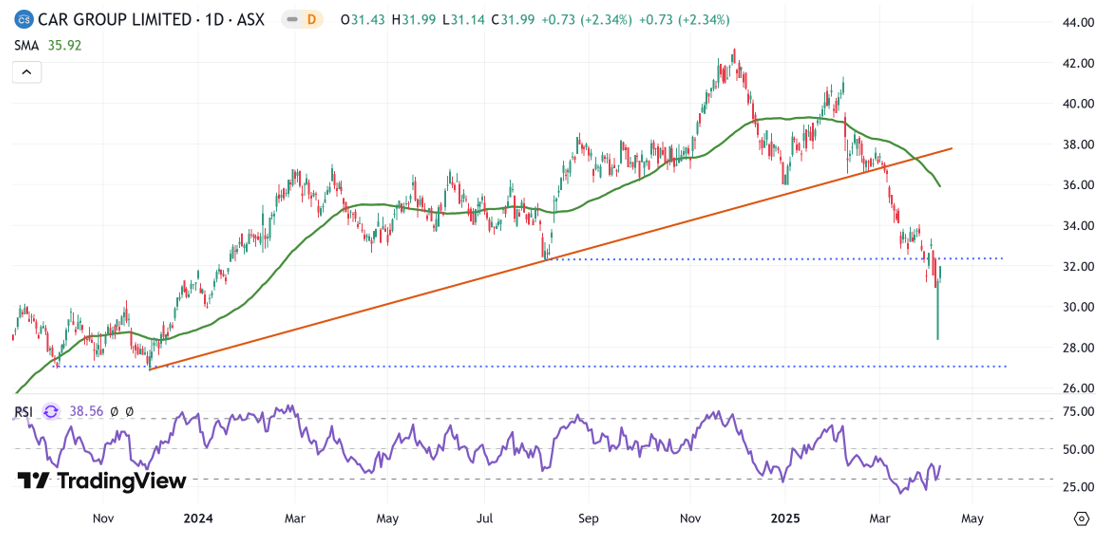
CAR Group Limited (ASX: CAR)
The stock price of CAR is down by 3.03% in the past five days, with today’s closing price of AUD 31.99, marking an uptick of 2.34%. The stock is down 8.70% in the past one month.
On the daily chart, CAR is respecting a downward trendline while facing resistance at a key horizontal level, signalling continued bearish pressure. The RSI stands at 37.50, reflecting sustained selling momentum. The stock remains below the 50-period Simple Moving Average (SMA), supporting the ongoing downtrend. With leading indicators pointing to weakness and limited buyer interest, the stock may continue its decline unless strong support is established in the sessions ahead.

Note 1: Past performance is not a reliable indicator of future performance.
Note 2: The reference data for all price data, currency, technical indicators, support, and resistance levels is 08 April 2025. The reference data in this report has been partly sourced from EODHD/Others.
Technical Indicators Defined
Support: A level at which the stock prices tend to find support if they are falling, and a downtrend may take a pause backed by demand or buying interest. Support 1 refers to the nearby support level for the stock, and if the price breaches the level, then Support 2 may act as the crucial support level for the stock.
Resistance: A level at which the stock prices tend to find resistance when they are rising, and an uptrend may take a pause due to profit booking or selling interest. Resistance 1 refers to the nearby resistance level for the stock, and if the price surpasses the level, then Resistance 2 may act as the crucial resistance level for the stock.
Abbreviations
CMP: Current Market Price
SMA: Simple Moving Average
AUD: Australian Dollar
RSI: Relative Strength Index


 Nov 12, 2026





 Please wait processing your request...