
 CA
 NZ
 UK
 US
 IND

 AU

 Share
 X (Formerly Twitter)
 Whatsapp
 Facebook
 LinkedIn
 Telegram
 Email This Article
 Copy Link
 Summarize with AI
 Chat GPT
 Perplexity

Key Highlights
- BOQ previously completed a large-scale head and shoulders pattern, generating a significant bearish signal and ending the strong uptrend that had been in place during 2025.
- The stock is now developing a potential small inverse head and shoulders pattern near a major support zone around $6.26.
- A breakout above the neckline resistance near $6.37 would confirm the bullish reversal pattern and signal that the recent correction phase may be ending.
- Based on the pattern's measured-move projection, the initial upside target is located near $6.89.
- Despite the improving near-term outlook, the broader technical picture remains influenced by the larger head and shoulders pattern completed earlier.
Bank of Queensland Limited (ASX: BOQ) has experienced a challenging period following the completion of a large-scale head and shoulders pattern that marked the end of its previous uptrend. After declining from the 2025 highs, the stock appears to be stabilising around a key support zone and is now developing a potential inverse head and shoulders formation. This emerging pattern suggests selling pressure may be easing and that buyers are beginning to re-establish control.
Stable Banking Franchise and Attractive Dividend Profile
BOQ remains one of Australia's established regional banking institutions, providing retail banking, business lending, commercial banking, and financial services across the country. The bank continues to benefit from its diversified lending portfolio, strong customer relationships, and focus on regional and small-business markets.
The company also offers an attractive dividend profile, which continues to appeal to income-focused investors. In addition, management's ongoing focus on operational efficiency, digital transformation initiatives, and balance-sheet discipline may help support earnings stability over the longer term. These factors provide a supportive fundamental backdrop as the stock attempts to recover from its recent correction.
Associated Risks
Despite the improving technical setup, BOQ remains exposed to risks associated with economic growth, credit quality, interest-rate movements, and regulatory developments. A deterioration in economic conditions could negatively affect loan demand and increase impairment expenses across the banking sector.
Furthermore, the inverse head and shoulders pattern remains unconfirmed at this stage. Failure to break above the neckline resistance near $6.37, or a decline below the key support zone around $6.26, could result in renewed selling pressure and continuation of the broader downtrend.
Technical Analysis Outlook
BOQ's daily chart is displaying the early stages of a potential recovery following a significant bearish reversal completed last year. While short-term momentum appears to be improving, investors should recognise that the broader technical picture remains influenced by the larger head and shoulders pattern that drove the stock lower.
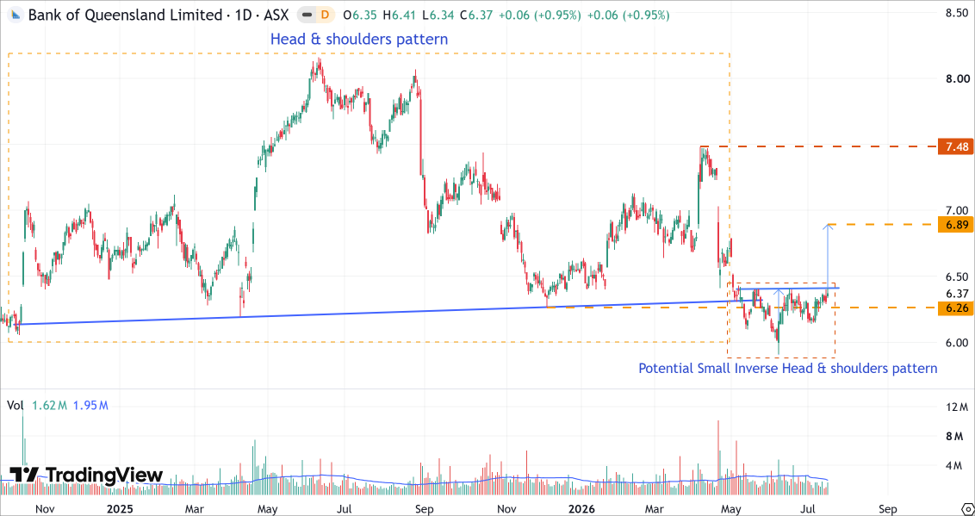
BOQ's Daily Price Chart (at the closing price of 16/07/2026). Powered by: tradingview.com
- On the daily chart, BOQ previously completed a large-scale head and shoulders pattern, generating a significant bearish signal and marking the end of the strong uptrend that had been in place throughout 2025.
- Following the correction, the stock has developed a potential small inverse head and shoulders pattern near the major support zone around $6.26. A breakout above the neckline resistance near $6.40 would confirm the bullish reversal and suggest that selling pressure has eased.
- Based on the pattern's measured-move projection, the initial upside target is located near $6.89.
- A successful breakout above $6.89 would improve the broader technical outlook and could open the door for a move towards the next major resistance level near $7.48.
- However, until the stock decisively overcomes the overhead resistance zone near $7.48, investors should recognise that the broader implications of the larger head and shoulders pattern have not been fully neutralised.
Bottom Line
Bank of Queensland Limited (ASX: BOQ) appears to be attempting a recovery after experiencing a sizeable correction triggered by a large-scale head and shoulders pattern. The development of a potential inverse head and shoulders formation near key support levels suggests selling pressure may be fading and that buyers are beginning to regain confidence.
However, the bullish reversal remains unconfirmed until the stock breaks above the neckline resistance near $6.37. While such a breakout would open the door for a move towards $6.89 and potentially $7.48, investors should remain mindful that the broader technical picture remains influenced by the earlier bearish reversal pattern. Until stronger resistance levels are overcome, the current move should be viewed as a developing recovery rather than a confirmed long-term trend reversal.


 Nov 12, 2026





 Please wait processing your request...