Image source: © 2025 Krish Capital Pty.Ltd
Highlights
- Each index reflects different sectors and company types, making them useful for tracking economic trends.
- Index structures such as market cap weighting or price weighting affect how company performance influences overall market movements.
- These indices are used to gauge investor sentiment, evaluate portfolio performance, and analyse market health.
Stock market indices provide a snapshot of overall market conditions by tracking the performance of selected groups of stocks. Investors and analysts rely on these indices to assess market direction, volatility, and economic sentiment. While no single index captures the entire market, combining different benchmarks allows for a more complete view.
The following three indices form the foundation for tracking US market trends, with each offering a distinct perspective on different segments of the economy. Each offers a unique lens on economic activity, sector trends, and corporate performance.
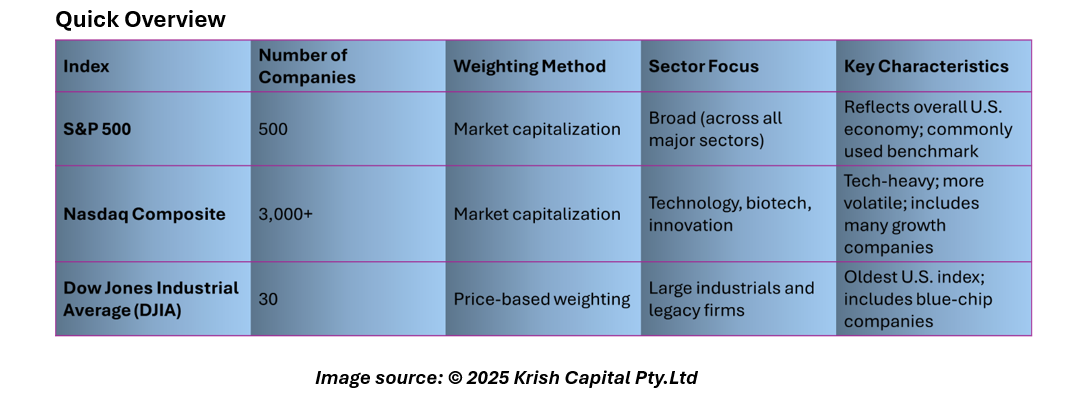
S&P 500 Reflects Broad Market Trends
The S&P 500 index comprises 500 of the largest publicly traded companies in the United States, chosen based on market capitalization, liquidity, and sector representation. It includes firms from diverse industries such as healthcare, technology, consumer goods, and energy.
Because of its broad composition, the S&P 500 is often seen as a proxy for the overall U.S. economy. Institutional and retail investors alike use its movements to gauge long-term market direction and performance benchmarks for portfolios. The index is weighted by market capitalisation, meaning larger companies exert more influence on the index’s value.
Nasdaq Captures the Pulse of Technology and Innovation
The Nasdaq Composite tracks more than 3,000 listed securities, with a strong concentration in technology and biotech companies, making it especially reflective of innovation-driven sectors.
The index is heavily influenced by growth-oriented and innovation-driven firms, making it more volatile compared to broader benchmarks. Despite its tech-heavy focus, it also includes firms from financial, industrial, and consumer sectors. Its performance is often viewed as a barometer for risk appetite and investor confidence in innovation and emerging business models.
Dow Jones Tracks Legacy and Stability
The Dow Jones Industrial Average (DJIA) consists of 30 well-established U.S. companies, often referred to as blue-chip stocks. These include major names in industries such as manufacturing, retail, and finance.
In contrast to the S&P 500 and Nasdaq, the DJIA assigns greater influence to stocks with higher trading prices, regardless of their overall market capitalization, due to its price-weighted structure. Though it covers fewer stocks, the Dow is widely watched due to its historical significance and inclusion of companies with long-standing market presence.
Indices as a Tool for Market Analysis
Investors use stock indices for multiple purposes, including evaluating fund performance, comparing asset allocation strategies, and assessing market volatility. Many mutual funds and exchange-traded funds (ETFs) aim to track these indices, providing low-cost ways for individuals to gain exposure to a wide range of companies.
Each index responds differently to economic shifts, interest rate changes, and geopolitical developments. Understanding the composition and weighting of each helps investors interpret market moves with greater clarity and make more informed financial decisions.
These major indices S&P 500, Nasdaq Composite, and Dow Jones Industrial Average form the core of U.S. market analysis and are key references in investment research, financial reporting, and public policy. By observing how these indices evolve, investors can monitor broader economic cycles and industry-specific trends with confidence.
Disclaimer:
This article (“Article”) has been prepared by Kalkine Pty Limited (ABN 34 154 808 312) (Australian financial services licence number 425376) (“Kalkine”) and its related bodies corporate who are authorised to provide general financial product advice. Kalkine.com.au and its associated pages are published by Kalkine.
Any information/advice provided in this article is general in nature and does not take into account your objectives, financial situation or needs. You should therefore consider whether the information is appropriate for your objectives, financial situation and needs before acting upon it.
There may be a Product Disclosure Statement, Information Memorandum or other offer document (“Offer Document”) for the securities or other financial products referred to in Kalkine articles. You should obtain a copy of the Offer Document and consider it before making any decision about whether to acquire the security or financial product.
Kalkine strongly recommends that you seek advice from a financial adviser, stockbroker or other professional (including taxation and legal advice) before acting on any advice/information in this Article or on the Kalkine website. Not all investments are appropriate for all people.
The information in this Article and on Kalkine website has been prepared from a wide variety of sources, which Kalkine, to the best of its knowledge and belief, considers accurate. Kalkine has made every effort to ensure the reliability of the information contained in its articles (including this Article), newsletters and websites. All information represents our views at the date of publication and may change without notice.
The information in this Article does not constitute an offer to sell securities or other financial products or a solicitation of an offer to buy securities or other financial products.
Kalkine does not issue, sell or deal in any financial products.
This Article may contain information on past performance of particular investments. Please note past performance is neither an indicator nor a guarantee of future performance.
To the extent permitted by law, and excluding any dishonesty or gross negligence by Kalkine, Kalkine disclaims and excludes all liability for any direct, indirect, implied, punitive, special, incidental or other consequential loss or damage arising from the use of or reliance on this Article, the Kalkine website and any information published on the Kalkine website without any warranties or representations by Kalkine to you. To the extent the law prohibits or limits this exclusion, Kalkine limits its liability to the resupply of services.
Please also read our Terms & Conditions and Financial Services Guide for further information.
Employees and/or associates of Kalkine and its related entities may hold interests in the securities or other financial products covered in this Article or on the Kalkine website. Any such employees and associates are required to comply with certain safeguards, procedures and disclosures as required by law.
Some of the images/music that may be used in the Article are copyright to their respective owner(s). Kalkine does not claim ownership of any of the pictures displayed/music used in the Article unless stated otherwise. The images/music that may be used in the Article are taken from various sources on the internet, including paid subscriptions or are believed to be in public domain. We have used reasonable efforts to accredit the source wherever it was indicated or was found to be necessary.
Kalkine Media Pty Ltd, an affiliate of Kalkine Pty Ltd, may have received, or be entitled to receive, financial consideration in connection with providing information about certain entity(s) covered on its website.
Copyright 2026 Krish Capital Pty. Ltd. (ABN 61629651510). All Rights Reserved. No part of this Article, or its content, may be reproduced in any form without our prior consent.
_09_10_2025_04_23_32_177180.jpg)


_02_19_2026_11_50_21_592067.png)

_02_11_2026_07_58_30_526403.png)

 Please wait processing your request...