…
Ingram Micro Holding Corporation, through its subsidiaries, distributes information technology (IT) products, cloud, and other services in North America, Europe, the Middle East, Africa, the Asia-Pacific, and Latin America. The company offers client and endpoint solutions, including desktop personal computers, notebooks, tablets, printers, hard drives, motherboards, video cards, application software, peripherals, accessories, phones, tablets, smart and feature phones, mobile phone accessories, wearables, and mobility software for corporate and individual end users. It also provides enterprise-grade hardware and software products, such as servers, storage, networking, and hybrid and software-defined solutions, as well as cybersecurity, power, and cooling solutions; training, professional services, and related financing solutions; and data capture/point-of-sale, physical security, audio visual and digital signage, unified communications and collaboration, and smart office/home automation and artificial intelligence products. In addition, the company offers third-party cloud-based services and subscriptions, including business applications, security, communications and collaboration, cloud enablement solutions, and infrastructure-as-a-service, as well as IT asset disposition, reverse logistics, repair, and other related solutions. It serves value-added and corporate resellers, retailers, custom installers, systems integrators, mobile network operators, mobile virtual network operators, direct marketers, internet-based resellers, independent dealers, product category specialists, reseller purchasing associations, managed service providers, cloud services providers, PC assemblers, independent agents and dealers, IT and mobile device manufacturers, and other distributors. The company was founded in 1979 and is headquartered in Irvine, California.

Source: TradingView
The charts and visual representations are sourced from TradingView through embedded widgets. For any issues with chart display, please visit the TradingView website
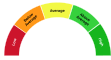
A unique technical analysis driven score developed by Kalkine showing momentum in stock prices based on select technical indicators identified.
Ingram Micro Holding Corporation is a global distributor of technology products, cloud services and supply‑chain solutions that connects hardware and software vendors with resellers and service providers through logistics, lifecycle management and a cloud marketplace. Long-term growth drivers include rising adoption of cloud and software-as-a-service, growth in e-commerce and supply-chain outsourcing, and expansion of value-added managed services and cloud marketplaces. Investors may find the company attractive for its scale, wide vendor and channel relationships and increasing recurring revenue from cloud and services.
Primary investment risks are sensitivity to IT spending cycles and thin distribution margins under pressure from vendor direct sales and competition, sizable working-capital and inventory exposure, and foreign-exchange and macroeconomic volatility.
Note: The summary and risk score provided above is created by AI and should not be construed as a recommendation of Kalkine.
| Breakdown | 2025-12-31 | 2024-12-31 | 2023-12-31 | 2022-12-31 | 2021-12-31 |
|---|---|---|---|---|---|
| Type | yearly | yearly | yearly | yearly | yearly |
| Date | 2025-12-31 | 2024-12-31 | 2023-12-31 | 2022-12-31 | 2021-12-31 |
| Income before tax | 530.75M | 445.87M | 522.50M | 2814.54M | 621.71M |
| Net income | 327.88M | 264.22M | 352.71M | 2394.49M | 475.21M |
| Selling general administrative | 2611.61M | 20.68M | 26.93M | 51.77M | 16.66M |
| Selling and marketing expenses | - | 2567.99M | 2538.27M | 2660.23M | 3125.84M |
| Gross profit | 3503.97M | 3444.95M | 3547.14M | 3693.39M | 4110.47M |
| Reconciled depreciation | 326.22M | 318.27M | 292.79M | 298.37M | 356.34M |
| Ebit | 833.50M | 784.03M | 902.69M | 3134.77M | 967.97M |
| Ebitda | 1159.71M | 1102.29M | 1195.48M | 3433.14M | 1205.00M |
| Depreciation and amortization | 326.22M | 318.27M | 292.79M | 298.37M | 237.03M |
| Operating income | 936.66M | 817.92M | 944.35M | 3248.93M | 849.26M |
| Other operating expenses | 51619.61M | 47165.75M | 47096.02M | 47575.56M | 53606.31M |
| Interest expense | 302.74M | 338.36M | 380.19M | 320.23M | 312.64M |
| Tax provision | 202.87M | 181.64M | 169.79M | 420.05M | 110.14M |
| Interest income | 45.73M | 45.34M | 34.98M | 22.91M | 18.05M |
| Net interest income | -256.84M | -293.02M | -345.21M | -297.32M | -294.59M |
| Income tax expense | 202.87M | 181.64M | 169.79M | 420.05M | 146.50M |
| Total revenue | 52556.26M | 47983.67M | 48040.36M | 50824.49M | 54455.57M |
| Total operating expenses | 2567.31M | 2627.02M | 2602.79M | 444.46M | 3261.21M |
| Cost of revenue | 49052.29M | 44538.73M | 44493.23M | 47131.10M | 50345.10M |
| Total other income expense net | -405.90M | -372.06M | -421.85M | -434.39M | -227.55M |
| Net income from continuing ops | 327.88M | 264.22M | 352.71M | 2394.49M | 366.11M |
| Breakdown | 2025-12-31 | 2024-12-31 | 2023-12-31 | 2022-12-31 | 2021-12-31 |
|---|---|---|---|---|---|
| Type | yearly | yearly | yearly | yearly | yearly |
| Date | 2025-12-31 | 2024-12-31 | 2023-12-31 | 2022-12-31 | 2021-12-31 |
| Total assets | 21244.38M | 18779.69M | 18420.31M | 19087.97M | 19797.71M |
| Intangible assets | 711.81M | 772.57M | 880.43M | 957.47M | 1076.22M |
| Other current assets | 859.25M | 734.94M | 757.40M | 713.63M | 1642.18M |
| Total liab | 16995.97M | 15045.82M | 14914.02M | 16029.91M | 17104.28M |
| Total stockholder equity | 4248.42M | 3733.88M | 3506.29M | 3058.07M | 2693.43M |
| Other current liab | 1163.59M | 1021.96M | 1061.41M | 1172.43M | 1898.35M |
| Common stock | 2.35M | 2.35M | - | - | - |
| Capital stock | 2.35M | 2.35M | 2.22M | 0.00M | 0.00M |
| Retained earnings | 1587.33M | 1337.40M | 1079.78M | 737.53M | 96.73M |
| Good will | 854.75M | 833.66M | 851.78M | 844.74M | 864.86M |
| Cash | 1864.72M | 918.40M | 948.49M | 1320.14M | 1227.88M |
| Total current liabilities | 13680.96M | 11306.53M | 10663.13M | 11307.74M | 11984.66M |
| Net debt | 1794.00M | 2898.12M | 3446.82M | 3465.15M | 3928.90M |
| Short term debt | 554.05M | 278.75M | 371.28M | 288.58M | 275.02M |
| Short long term debt | 449.58M | 184.86M | 265.72M | 200.33M | 179.33M |
| Short long term debt total | 3658.73M | 3816.52M | 4395.31M | 4785.28M | 5156.77M |
| Other stockholder equity | 2921.95M | 2903.84M | 2658.00M | 2658.00M | 2658.00M |
| Total current assets | 18240.64M | 15801.18M | 15354.32M | 16174.68M | 16678.28M |
| Net receivables | 10546.55M | 9448.35M | 8988.80M | 8782.99M | 8521.03M |
| Long term debt | 2749.78M | 3168.28M | 3657.89M | 4174.03M | 4640.89M |
| Inventory | 4970.11M | 4699.48M | 4659.62M | 5357.93M | 5287.19M |
| Accounts payable | 11963.32M | 10005.82M | 9230.44M | 9846.72M | 9811.29M |
| Accumulated other comprehensive income | -263.21M | -509.71M | -231.49M | -337.46M | -61.30M |
| Non currrent assets other | 502.07M | 383.35M | 450.29M | 388.99M | 444.71M |
| Non current assets total | 3003.74M | 2978.51M | 3066.00M | 2913.29M | 3119.43M |
| Capital lease obligations | 459.36M | 463.38M | 471.70M | 410.93M | 336.56M |
| Breakdown | 2025-12-31 | 2024-12-31 | 2023-12-31 | 2022-12-31 | 2021-12-31 |
|---|---|---|---|---|---|
| Type | yearly | yearly | yearly | yearly | yearly |
| Date | 2025-12-31 | 2024-12-31 | 2023-12-31 | 2022-12-31 | 2021-12-31 |
| Investments | 33.29M | 105.54M | -17.71M | 3028.77M | -111.88M |
| Total cashflows from investing activities | 267.64M | 105.54M | -17.71M | 3028.77M | -111.88M |
| Net borrowings | -209.59M | -566.65M | -448.60M | -472.40M | 2030.57M |
| Total cash from financing activities | -306.22M | -391.30M | -477.94M | -2465.31M | 1580.62M |
| Net income | 327.88M | 264.22M | 352.71M | 2394.49M | 756.95M |
| Change in cash | 946.32M | -30.09M | -371.65M | 90.12M | 288.23M |
| Begin period cash flow | 918.40M | 948.49M | 1320.14M | 1230.02M | 2820.36M |
| End period cash flow | 1864.72M | 918.40M | 948.49M | 1320.14M | 3108.59M |
| Total cash from operating activities | 916.13M | 333.84M | 58.82M | -361.11M | -1159.68M |
| Issuance of capital stock | 0.00M | 241.16M | 0.00M | 0.00M | 0.00M |
| Depreciation | 326.22M | 318.27M | 292.79M | 298.37M | 356.34M |
| Other cashflows from investing activities | 345.11M | 235.28M | 184.37M | 3166.52M | 43.70M |
| Dividends paid | 78.38M | 6.17M | 10.46M | 1753.70M | 430.36M |
| Change to inventory | -88.22M | -225.83M | 772.40M | -210.22M | -418.55M |
| Change to account receivables | -1105.97M | -1060.81M | -299.83M | -590.58M | 1863.10M |
| Sale purchase of stock | -3.09M | -36.78M | 0.00M | 0.00M | - |
| Other cashflows from financing activities | -15.16M | -22.85M | -18.88M | -239.22M | -19.59M |
| Capital expenditures | 130.75M | 142.70M | 201.53M | 135.78M | 126.32M |
| Change in working capital | 185.67M | -282.51M | -563.66M | -701.80M | -2130.09M |
| Stock based compensation | 21.12M | 34.07M | 0.00M | 0.00M | - |
| Other non cash items | 83.31M | 14.77M | 32.15M | -2368.75M | -148.38M |
| Free cash flow | 785.37M | 191.14M | -142.71M | -496.89M | -1286.00M |
Sector: Technology Industry: Information Technology Services
|
Stock Name
|
Change
(USD) |
Price
(USD) |
Trailing
PE (x) |
Forward
PE (x) |
Price Sales
TTM (x) |
Price to Book Value (x)
|
Enterprise Value
to Revenue (x) |
Enterprise Value
to EBITDA (x) |
|---|---|---|---|---|---|---|---|---|
| INGM Ingram Micro Holding Corporation |
0.63 2.39% |
26.98 | 14.62 | 7.20 | 0.11 | 1.44 | 0.17 | 7.39 |
| IBM International Business Machines |
-1.55 0.68% |
225.51 | 22.06 | 18.73 | 3.39 | 6.81 | 4.22 | 16.61 |
| ACN Accenture plc |
-1.30 0.73% |
176.11 | 16.00 | 14.29 | 1.66 | 3.84 | 1.65 | 9.80 |
| INFY Infosys Ltd ADR |
- -% |
10.50 | 25.55 | 22.78 | 4.20 | 8.01 | 4.10 | 15.87 |
| FJTSF Fujitsu Limited |
- -% |
23.97 | 21.97 | 14.84 | 0.01 | 3.44 | 1.86 | 11.66 |
Ingram Micro Holding Corporation, through its subsidiaries, distributes information technology (IT) products, cloud, and other services in North America, Europe, the Middle East, Africa, the Asia-Pacific, and Latin America. The company offers client and endpoint solutions, including desktop personal computers, notebooks, tablets, printers, hard drives, motherboards, video cards, application software, peripherals, accessories, phones, tablets, smart and feature phones, mobile phone accessories, wearables, and mobility software for corporate and individual end users. It also provides enterprise-grade hardware and software products, such as servers, storage, networking, and hybrid and software-defined solutions, as well as cybersecurity, power, and cooling solutions; training, professional services, and related financing solutions; and data capture/point-of-sale, physical security, audio visual and digital signage, unified communications and collaboration, and smart office/home automation and artificial intelligence products. In addition, the company offers third-party cloud-based services and subscriptions, including business applications, security, communications and collaboration, cloud enablement solutions, and infrastructure-as-a-service, as well as IT asset disposition, reverse logistics, repair, and other related solutions. It serves value-added and corporate resellers, retailers, custom installers, systems integrators, mobile network operators, mobile virtual network operators, direct marketers, internet-based resellers, independent dealers, product category specialists, reseller purchasing associations, managed service providers, cloud services providers, PC assemblers, independent agents and dealers, IT and mobile device manufacturers, and other distributors. The company was founded in 1979 and is headquartered in Irvine, California.
3351 Michelson Drive, Irvine, CA, United States, 92612-0697
714 566 1000
22200
| Name | Title | Year Born |
|---|---|---|
| Mr. Paul D. Bay | CEO & Director | 1970 |
| Mr. Michael Zilis | Executive VP & CFO | 1970 |
| Mr. Augusto P. Aragone | Executive VP, Secretary & General Counsel | 1974 |
| Mr. Scott D. Sherman | Executive Vice President of Human Resources | 1966 |
| Mr. Bill Ross | Executive VP of Global Operations & Engineering | NA |
| Ms. Cari Hornstein | VP, Controller & Chief Accounting Officer | NA |
| Ms. Willa Mcmanmon | Vice President of Investor Relations | NA |
| Ms. Jennifer Baier Anaya | Senior Vice President of Global Marketing | NA |
| Mr. Tim Ament | Senior VP of Advanced Solutions and Chief Country Officer of Australia & New Zealand | NA |
| Mr. Matthew Sanderson | Executive VP & President of EMEA | NA |
Disclaimer - (*)This information, including any data, is sourced from Unicorn Data Services SAS, trading as EOD Historical Data (“EODHD”) on an ‘as is’ basis, using their API. We cannot guarantee the completeness or validity of the information and data provided on this page, as well as via the API. In some cases, the data may include analyst ratings or recommendations sourced through the EODHD API, which are intended solely for general information purposes.
This information does not consider your personal objectives, financial situation, or needs. Kalkine is not liable for any errors or omissions in the information provided or for any actions taken in reliance on it. You should seek advice from a financial adviser, stockbroker or other professional adviser (including taxation and legal advice) as necessary before acting on this information.