
 CA
 NZ
 UK
 US
 IND

 AU

 Share
 X (Formerly Twitter)
 Whatsapp
 Facebook
 LinkedIn
 Telegram
 Email This Article
 Copy Link
 Summarize with AI
 Chat GPT
 Perplexity

Image source: © 2025 Krish Capital Pty. Ltd.
Highlights
- WOR’s FY25 revenue increased 4% YoY to AUD 12,050 million from AUD 11,616 million in FY24.
- Statutory NPATA rose 29% to AUD 475 million, up from AUD 367 million in FY24.
- The company is conducting a market buyback program of up to AUD 500 million.
Worley Limited (ASX:WOR), headquartered in Australia, provides engineering design, project delivery, maintenance, reliability, and advisory services to the energy, chemicals, and resources industries.
In the financial year 2025 (FY25), the company recorded revenue of AUD 12,050 million, compared with AUD 11,616 million in FY24, an increase of 4% YoY. The growth was mainly driven by the contributions from Americas and EMEA regions, as well as energy and resources projects. Statutory NPATA reached AUD 475 million in FY25, up 29% YoY. Meanwhile, EBITA rose 10% due to project execution, higher procurement volumes, and a larger share of construction and fabrication, while the chemicals sector reported weaker results. Operating cash flow reached AUD 741 million in FY25, compared with AUD 682 million in FY24, up 9% YoY.
Business Update
On 25 September 2025, the company announced that it is conducting a market buyback program of up to AUD 500 million of fully paid ordinary shares. As of 24 September 2025, the company had bought back 15.55 million shares, with a total spend of AUD 203.7 million.
Key Positives and Negatives
The company reported a 32% year-on-year increase in bookings as of June 30, 2025, along with a 22% year-on-year rise in backlog during FY25. The current ratio declined to 1.03x in FY25 from 1.24x in FY24, while the cash cycle lengthened to 57.2 days in FY25 compared to 54.9 days in FY24.
Company Outlook
For FY26, the company expects revenue growth to be higher than in FY25 and anticipates the underlying EBITDA margin (excluding procurement) to be in the range of 9.0% to 9.5%.
The company is implementing a five-pillar operational strategy aimed at supporting future performance. This strategy includes AI integration, organisational restructuring, and cost optimization. Key focus areas are full project delivery, scaling Global Integrated Delivery (GID), and embedding digital tools to improve productivity, manage overheads, and maintain margin stability.
Share Performance of WOR
WOR stock closed at AUD 14.100 per share on 25 September 2025. Over the past year, the share price fell 3.68%, up by 8.04% in the last three months, but down 4.40% in the past six months. The 52-week high of WOR is AUD 15.810, recorded on 27 Feb 2025, and the 52-week low is AUD 11.070, recorded on 11 April 2025.
Resistance and Support Summary
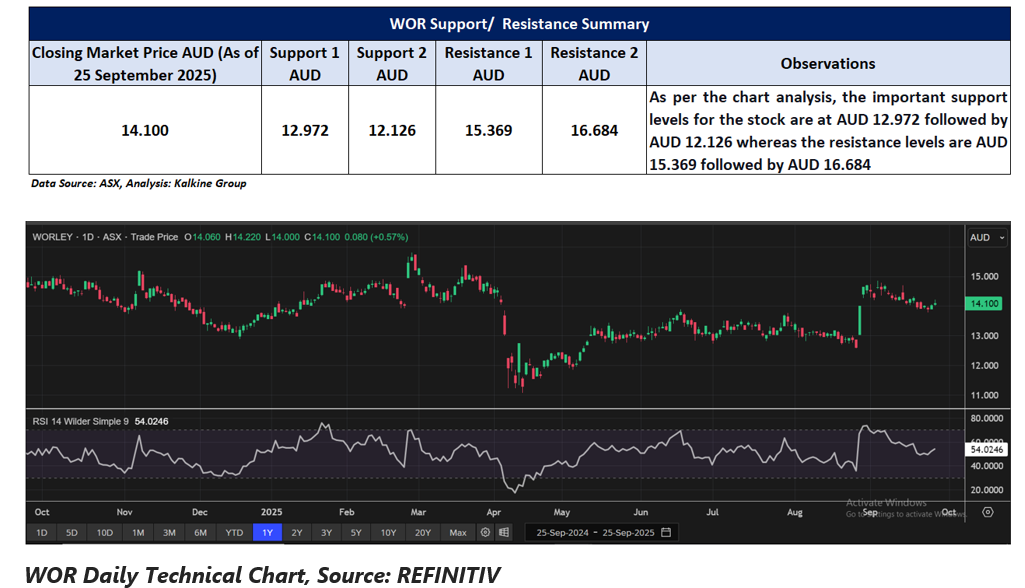
Note 1: Past performance is neither an Indicator nor a guarantee of future performance.
Note 2: The reference date for all price data, and currency, is 25 September 2025. The reference data in this report has been partly sourced from EODHD/Others.
Technical Indicators Defined:
Support: A level at which the stock prices tend to find support if they are falling, and a downtrend may take a pause backed by demand or buying interest. Support 1 refers to the nearby support level for the stock and if the price breaches the level, then Support 2 may act as the crucial support level for the stock.
Resistance: A level at which the stock prices tend to find resistance when they are rising, and an uptrend may take a pause due to profit booking or selling interest. Resistance 1 refers to the nearby resistance level for the stock and if the price surpasses the level, then Resistance 2 may act as the crucial resistance level for the stock.


 Nov 12, 2026





 Please wait processing your request...