
 CA
 NZ
 UK
 US
 IND

 AU

 Share
 X (Formerly Twitter)
 Whatsapp
 Facebook
 LinkedIn
 Telegram
 Email This Article
 Copy Link
 Summarize with AI
 Chat GPT
 Perplexity

Key Highlights
- Westgold Resources continues leveraging its expanding Western Australian gold production platform, benefiting from elevated long-term bullion prices and ongoing operational integration initiatives.
- Despite supportive macro conditions for gold producers, institutional sentiment toward WGX has deteriorated sharply as persistent selling pressure and profit-taking activity weigh heavily on the stock.
- The technical structure is flashing highly bearish macro signals, characterized by the confirmed breakdown of a large-scale Head &Amp; Shoulders Reversal pattern on the Daily Chart.
While Westgold Resources (ASX) previously benefited from strong momentum driven by elevated gold prices and improving production expectations, the underlying technical landscape has now shifted decisively bearish. Following an extended accumulation and markup phase throughout late 2024 and early 2025, the stock has transitioned into a clear institutional distribution cycle.
The recent breakdown beneath critical structural support levels suggests that long-term bullish momentum has exhausted, opening the path toward a potentially deeper cyclical correction phase despite the broader resilience in precious metals markets.
The Gold Production Platform and Margin Leverage
WGX’s long-term Investment thesis remains supported by several structural strengths within the gold sector:
- Expanding Production Profile: Westgold continues strengthening its position as a major Western Australian gold producer through ongoing operational optimization, reserve development, and integration of strategic Mining Assets.
- Strong Leverage to Gold Prices: Elevated bullion prices continue supporting sector-wide profitability and free Cash Flow generation. Gold producers remain structurally leveraged to ongoing macro uncertainty, Inflation risks, and central-bank Demand for safe-haven assets.
- Operational Improvement Potential: Management continues focusing on production efficiency, cost discipline, and operational integration initiatives aimed at stabilizing margins and improving long-term scalability across its asset portfolio.
- Long-Term Precious Metals Demand: Structural demand for gold remains supported by global macro Volatility, geopolitical uncertainty, and persistent Diversification flows into defensive Commodity exposure.
Associated Risks
- Despite favorable long-term commodity fundamentals, Westgold remains exposed to substantial operational and market-related risks. A sustained decline in gold prices would immediately pressure operating margins and reduce free cash flow generation across the Business.
- The company also faces execution risks associated with mine integration, production reliability, labor shortages, input-cost inflation, and operational disruptions. Additionally, heightened volatility across precious metals equities may continue amplifying downside pressure during periods of broader Market Risk aversion.
Technical Outlook
The daily chart for Westgold Resources presents a textbook bearish reversal structure, signaling that the prior accumulation phase has likely transitioned into a new markdown cycle.
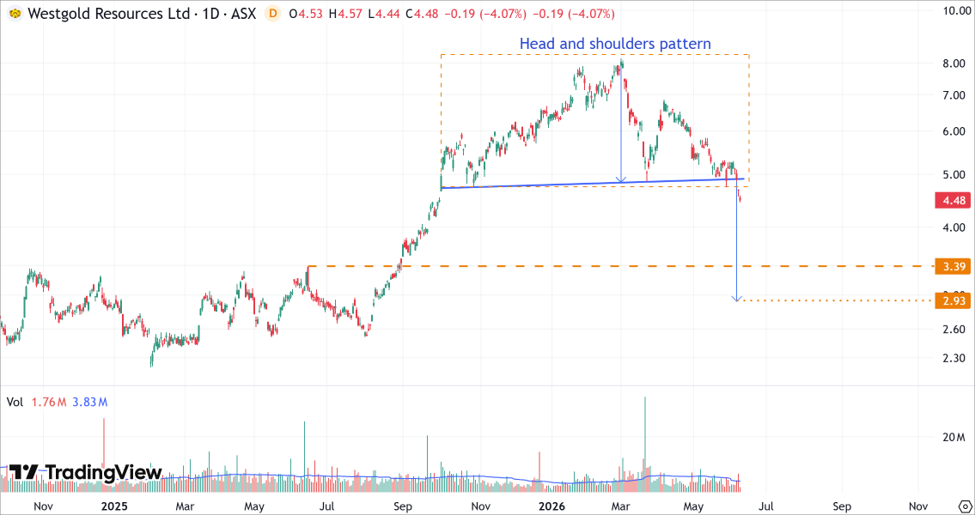
WGX’s Daily Price Chart (at the Market Price of 10/06/2026). Powered by: tradingview.com
- On the daily chart, WGX’s stock price completed a Head and Shoulders pattern, reflecting a gradual exhaustion of bullish momentum and a transfer of market control toward institutional sellers.
- The critical structural event has now occurred, with price action decisively breaking beneath the neckline support zone near $4.85. This breakdown officially validates the bearish reversal structure and confirms the beginning of an active downside phase.
- Following the confirmed breakdown, the pattern’s measured move projects a potential downside target near $2.93. However, intermediate support may emerge around the October 2024 consolidation region near $3.39, where temporary stabilization or short-term rebounds could occur.
Westgold Resources (ASX) now presents a technically fragile structure despite the supportive longer-term backdrop for gold producers. The confirmed breakdown from a large-scale Head & Shoulders distribution pattern signals that institutional selling pressure has overtaken the previous bullish accumulation cycle.
Active investors should exercise elevated caution while closely monitoring price behavior around the broken neckline zone near $4.85. Unless the stock can rapidly reclaim this critical resistance level, the broader technical structure continues favoring a multi-month corrective decline toward the projected $2.93 downside objective.


 Nov 12, 2026





 Please wait processing your request...