
 CA
 NZ
 UK
 US
 IND

 AU

 Share
 X (Formerly Twitter)
 Whatsapp
 Facebook
 LinkedIn
 Telegram
 Email This Article
 Copy Link
 Summarize with AI
 Chat GPT
 Perplexity

Highlights
- In FY25, revenue from continuing operations increased 15% year-on-year to AUD 954.6 million, supported by higher private equity, credit portfolio interest income, and dividend income.
- Statutory NPAT declined 27% to AUD 364.2 million in FY25, impacted by merger-related one-off items and higher income tax expenses.
- The company will be added to the S&P/ASX 50 Index effective 22 December 2025 following the December index rebalancing.
Washington H. Soul Pattinson and Company Ltd (ASX: SOL), an Australia-based investment holding company with interests in building products, has reported its financial performance for the 12-month period ended 31 July 2025 (FY25).
For FY25, revenue from continuing operations rose 15% YoY to AUD 954.6 million. The increase was supported by higher revenue from the private equity portfolio, growth in interest income driven by expansion in the credit portfolio, and increased dividend income. Despite higher revenue, statutory net profit after tax attributable to members of the company declined by 27% YoY to AUD 364.2 million. This decrease was impacted by one-off items related to the merger and higher income tax expenses, primarily resulting from increased interest income in the credit portfolio. The merger with Brickworks Limited was implemented on 23 September 2025.
Operational efficiency metrics showed mixed movement during the period. The cash cycle reduced to 224.5 days in FY25, compared with 249.7 days in FY24, while inventory turnover increased to 5.0 times from 4.7 times in the previous year. At the same time, return on equity declined to 4.0% from 5.6% in FY24, and the current ratio decreased to 1.33 times from 3.31 times over the same period.
Recent Business Update
On 5 December 2025, the company informed that it will be added to the S&P/ASX 50 Index, effective from 22 December 2025, as part of the scheduled index rebalancing.
Growth Prospects for Financial Sector
In the September quarter of 2025, Australia’s economy expanded by 0.4%, increasing annual GDP growth to 2.1%, based on seasonally adjusted data released by the Australian Bureau of Statistics. On a per-capita basis, GDP remained flat during the quarter but was 0.4% higher compared with the same period last year.
The household saving ratio jumped to 6.4% from 6.0% in the June quarter, reflecting faster growth in gross disposable income relative to household consumption. Income growth was supported by higher employee remuneration and improved investment returns from superannuation.
Outlook
Management views the company as well-set for sustained expansion, backed by its varied asset mix. In the property segment, construction advances steadily—Oakdale East Stage 2 moves forward alongside new facilities. These efforts should drive development profits in FY26 and FY27, with higher gains projected over the coming 3–5 years.
Industrial rents have cooled somewhat, but significant upside lingers across the full holdings. Building Products in Australia and North America face short-term softness from construction cycles yet stand ready for mid-term rebound fuelled by housing deficits, policy aid, and recent efficiency gains.
Share Performance of SOL
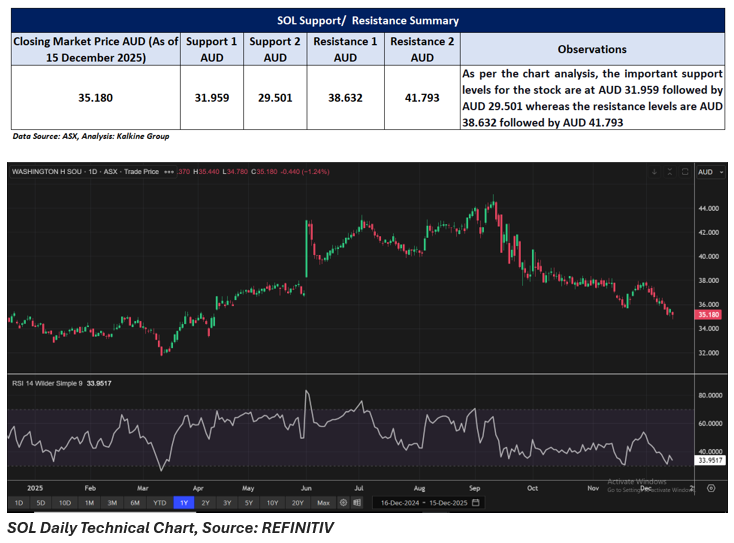
SOL shares ended at AUD 35.18 per share on 15 December 2025, recording a drop of 1.24%. The stock has experienced an increase 0.42% over the past year. It has fallen over most shorter periods, including a 3.38% drop in the last week, 7.37% in one month, and 13.16% in six months.
The 52-week high stands at AUD 45.14, recorded on 10 September 2025, while the 52-week low is AUD 31.70, reached on 12 March 2025.
Support and Resistance Summary
Note 1: Past performance is neither an Indicator nor a guarantee of future performance.
Note 2: The reference date for all price data, and currency, is 15 December 2025. The reference data in this report has been partly sourced from EODHD/Others.
Technical Indicators Defined:
Support: A level at which the stock prices tend to find support if they are falling, and a downtrend may take a pause backed by demand or buying interest. Support 1 refers to the nearby support level for the stock and if the price breaches the level, then Support 2 may act as the crucial support level for the stock.
Resistance: A level at which the stock prices tend to find resistance when they are rising, and an uptrend may take a pause due to profit booking or selling interest. Resistance 1 refers to the nearby resistance level for the stock and if the price surpasses the level, then Resistance 2 may act as the crucial resistance level for the stock.


 Nov 12, 2026





 Please wait processing your request...