
 CA
 NZ
 UK
 US
 IND

 AU

 Share
 X (Formerly Twitter)
 Whatsapp
 Facebook
 LinkedIn
 Telegram
 Email This Article
 Copy Link
 Summarize with AI
 Chat GPT
 Perplexity

Key Highlights
- Vulcan Steel reported stronger FY26 results, with reported EBITDA increasing 19% to NZ$129.3 million and adjusted EBITDA rising 16% to NZ$130.3 million.
- Underlying sales volumes increased 18% in FY26, marking the first year-on-year Volume growth since FY22.
- The Daily Chart shows a potential Inverse Head & Shoulders pattern developing after an extended decline from the January 2026 high.
- VSL is now testing the pattern neckline around $5.73 while also challenging the descending Trendline that has constrained the stock since early 2026.
- A sustained breakout above $5.73 could confirm the bullish Reversal formation and generate a measured upside target near $7.27.
- The previous major high around $7.77 represents an important secondary resistance level if the recovery gains further momentum.
Vulcan Steel Limited (ASX: VSL) is showing improving technical conditions following an extended decline from its early-2026 high. The stock has recovered strongly from the July low and is now approaching the critical $5.73 resistance zone, where the neckline of a potential Inverse Head & Shoulders formation converges with the broader descending trendline.
The improving technical structure is supported by a stronger FY26 operating performance. Vulcan reported Revenue of NZ$1.159 billion, up 22%, while adjusted EBITDA increased 16% to NZ$130.3 million. Sales volumes also increased 18%, providing a more constructive fundamental backdrop for a potential recovery.
Improving Operating Performance Supports Recovery Potential
Following a prolonged period of weakness, Vulcan's operating performance has begun to improve. FY26 represented an important step forward, with stronger volumes, higher Earnings and successful integration of the recently acquired rollforming business.
The company has also identified signs of recovery in both Australia and New Zealand, although economic conditions remain mixed. Management is focused on customer service, Margin improvement and further development of its hybrid site strategy as it enters FY27.
Earnings and Volume Recovery
- Stronger Earnings: Reported EBITDA increased 19% to NZ$129.3 million, while adjusted EBITDA rose 16% to NZ$130.3 million in FY26.
- Volume Growth: Sales volumes increased 18% to 252,820 tonnes, representing the first year-on-year growth since FY22.
- Improved Market Position: Vulcan continued to focus on operational improvements, Customer Service and Market Share growth across Australia and New Zealand.
Rollforming Expansion
- Acquisition Contribution: The recently acquired Roofing Industries rollforming Business made a strong contribution during FY26 and strengthened Vulcan's value-added processing capabilities.
Associated Risks
Despite the improving earnings profile, Vulcan remains exposed to cyclical conditions across the construction, infrastructure and industrial sectors. Weak economic activity could limit Demand for steel and metal products, while margin pressure could constrain future earnings growth.
The company also faces sensitivity to interest rates, input costs, global trade conditions and broader construction activity. Operating Cash Flow declined 30% to NZ$73.0 million in FY26, highlighting the importance of continued working-capital and balance-sheet management.
Technical Outlook
VSL is approaching an important technical inflection point, with the latest price action testing the neckline of a potential Inverse Head & Shoulders pattern while also challenging the descending trendline.
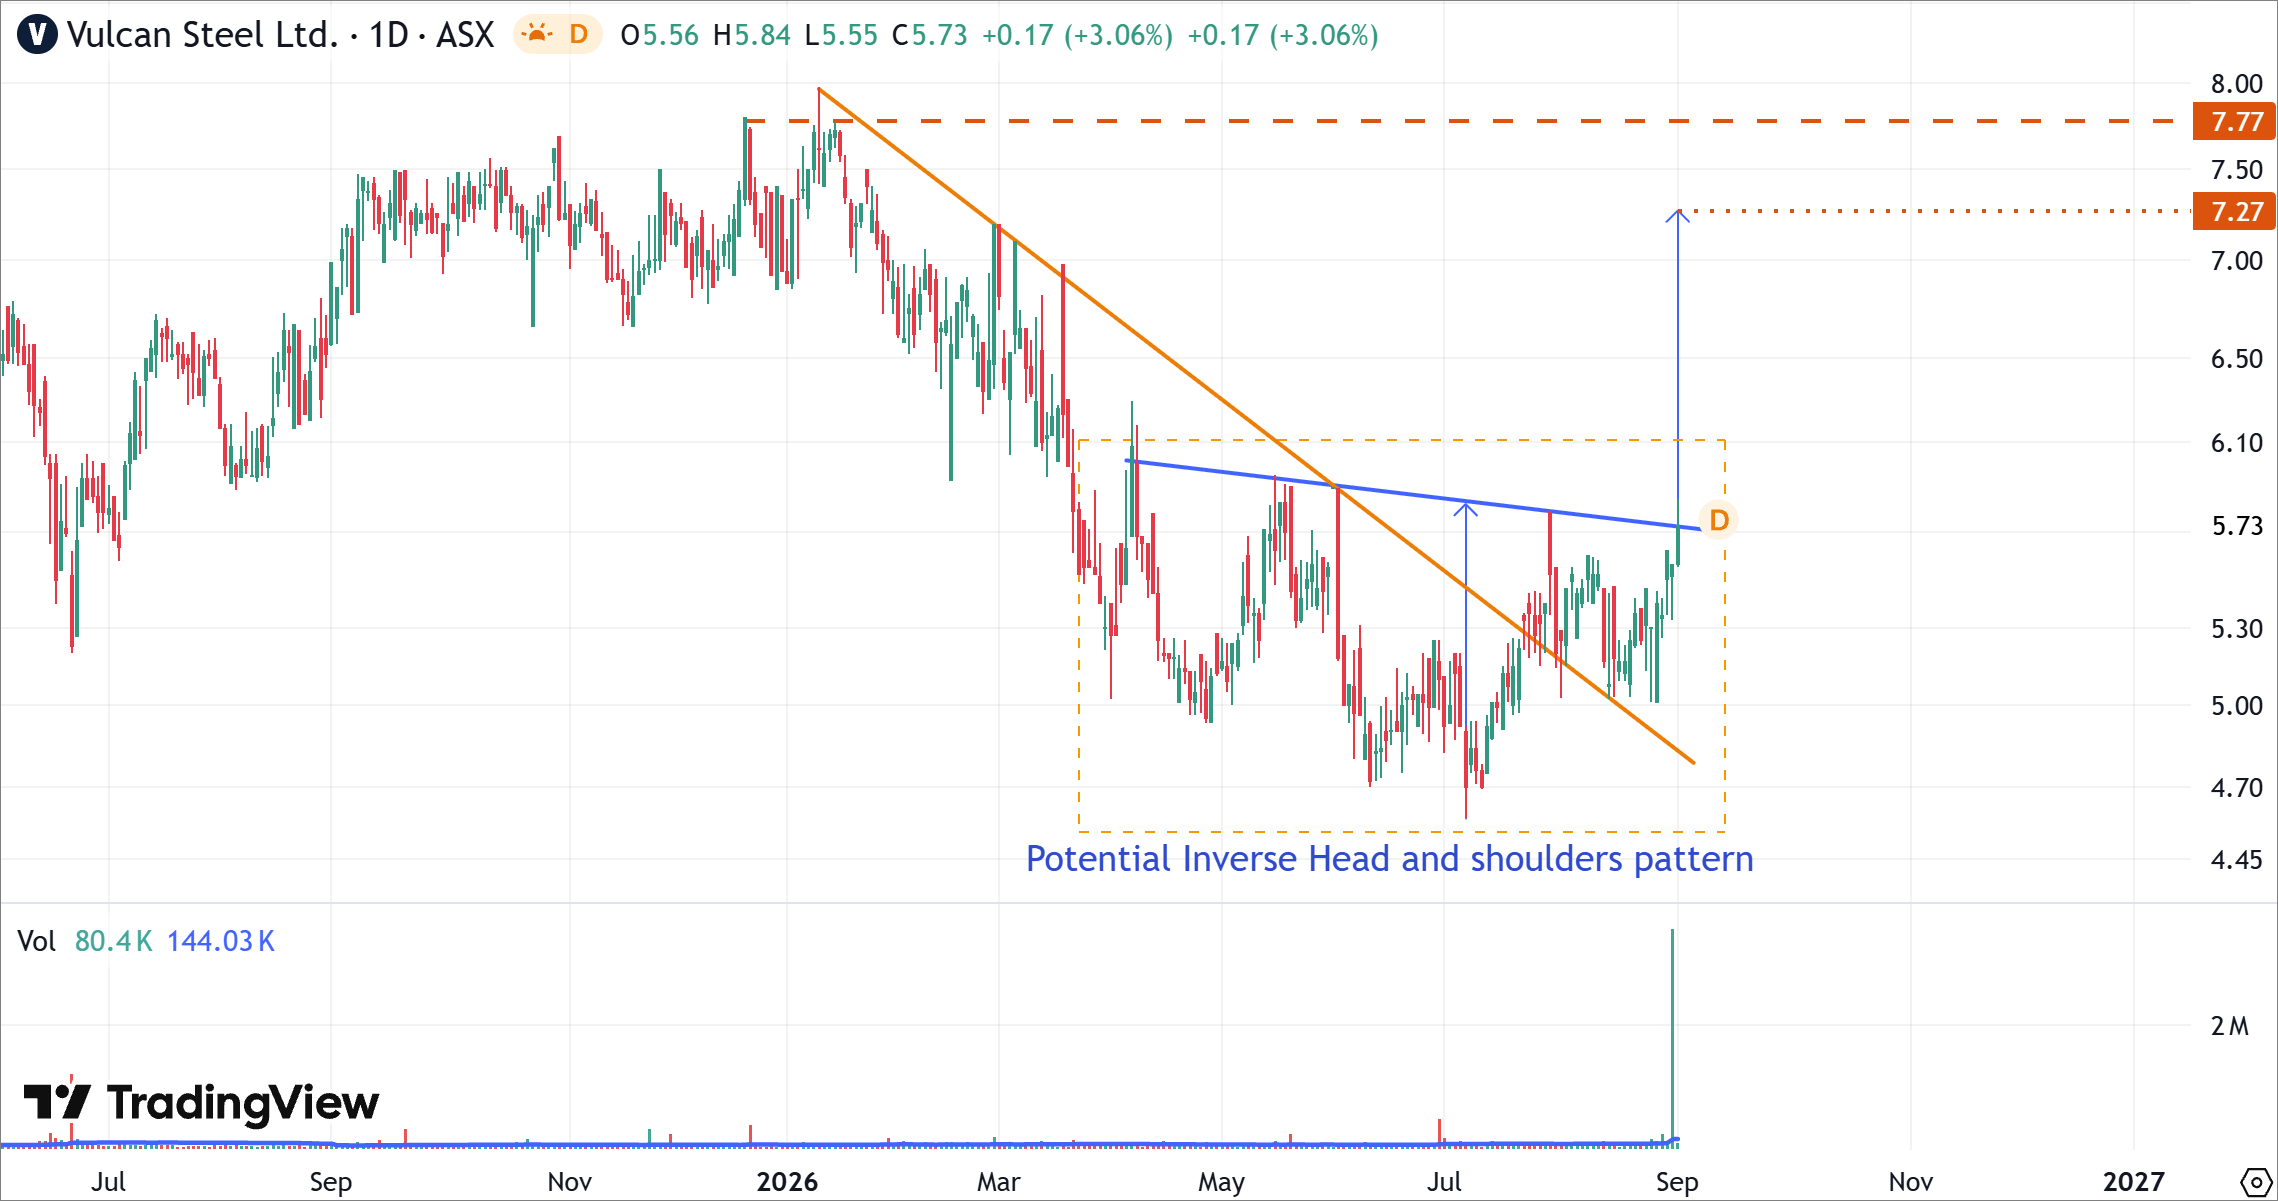
TLX's Daily Price Chart (at the closing price of 01/09/2026). Powered by: tradingview.com
- VSL has developed a potential Inverse Head & Shoulders formation following the extended decline from the January 2026 high. The left shoulder formed around $5.00, followed by a deeper head near $4.60 - $4.70 and a subsequent right shoulder around the $5.00 area.
- The neckline slopes downward from approximately $6.10 toward $5.73. The latest close at $5.73 places the stock directly at this important resistance zone.
- VSL has also moved above the descending trendline extending from the January peak, suggesting that the prevailing downtrend may be losing momentum.
- A confirmed breakout above the neckline would activate a measured upside target near $7.27, based on the height of the potential Inverse Head & Shoulders formation.
- The $7.27 measured target remains below the previous major high around $7.77, which could become the next significant resistance area if bullish momentum continues.
- The latest advance has been accompanied by a sharp increase in trading volume, strengthening interest in the potential breakout. However, sustained closes above $5.73 would provide stronger confirmation of the bullish setup.
Bottom Line
Vulcan Steel Limited (ASX: VSL) is showing a notable improvement in its medium-term technical outlook after a prolonged decline. The stock has moved above its descending trendline and is now testing the neckline of a potential Inverse Head & Shoulders formation around $5.73.
The fundamental backdrop has also improved, with FY26 revenue rising 22%, adjusted EBITDA increasing 16% and sales volumes returning to year-on-year growth. The contribution from the rollforming business and improving signs across the Australian and New Zealand markets provide additional support for a potential recovery.
The key level to watch is $5.73. A sustained breakout above this neckline would strengthen the bullish reversal setup and could open the way toward the $7.27 measured target. The previous high around $7.77 represents a further resistance level. Conversely, a sustained move back below the neckline would weaken the Inverse Head & Shoulders setup and increase the risk of renewed consolidation.


 Nov 12, 2026





 Please wait processing your request...