
 CA
 NZ
 UK
 US
 IND

 AU

 Share
 X (Formerly Twitter)
 Whatsapp
 Facebook
 LinkedIn
 Telegram
 Email This Article
 Copy Link
 Summarize with AI
 Chat GPT
 Perplexity

Key Highlights
- Eight Sectors in Leading: Real Estate (XLRE), Financials (XLF), Materials (XLB), Health Care (XLV), Consumer Discretionary (XLY), Utilities (XLU), Consumer Staples (XLP) and Industrials (XLI) occupy the Leading quadrant.
- No Sector in Improving: No sector has a latest endpoint in the upper-left quadrant, leaving Leadership concentrated among sectors with positive relative strength and momentum.
- Energy in Weakening: Energy (XLE) remains to the right of the vertical axis but well below the horizontal axis, indicating positive relative strength alongside notably negative momentum.
- Technology and Communication Services Lag: Technology (XLK) and Communication Services (XLC) remain in the lower-left quadrant, reflecting negative relative strength and momentum.
- Industrials Holds a Leading Position: Industrials (XLI) is above and to the right of the central intersection, confirming its classification in Leading rather than Improving.
- Leadership Is Broad but Uneven: Eight of eleven sectors are in Leading, although the separation between the leaders and laggards highlights meaningful differences in relative momentum.
The US sector Relative Rotation Graph dated 5 November 2026 shows a broad concentration of sectors in the Leading quadrant. Eight groups are positioned to the right of the vertical axis and above the horizontal axis, indicating positive relative strength and positive momentum. Industrials joins Real Estate, Financials, Materials, Health Care, Consumer Discretionary, Utilities and Consumer Staples in this quadrant. Energy is positioned in Weakening, while Technology and Communication Services remain in Lagging. No sector occupies Improving at the latest plotted endpoints.
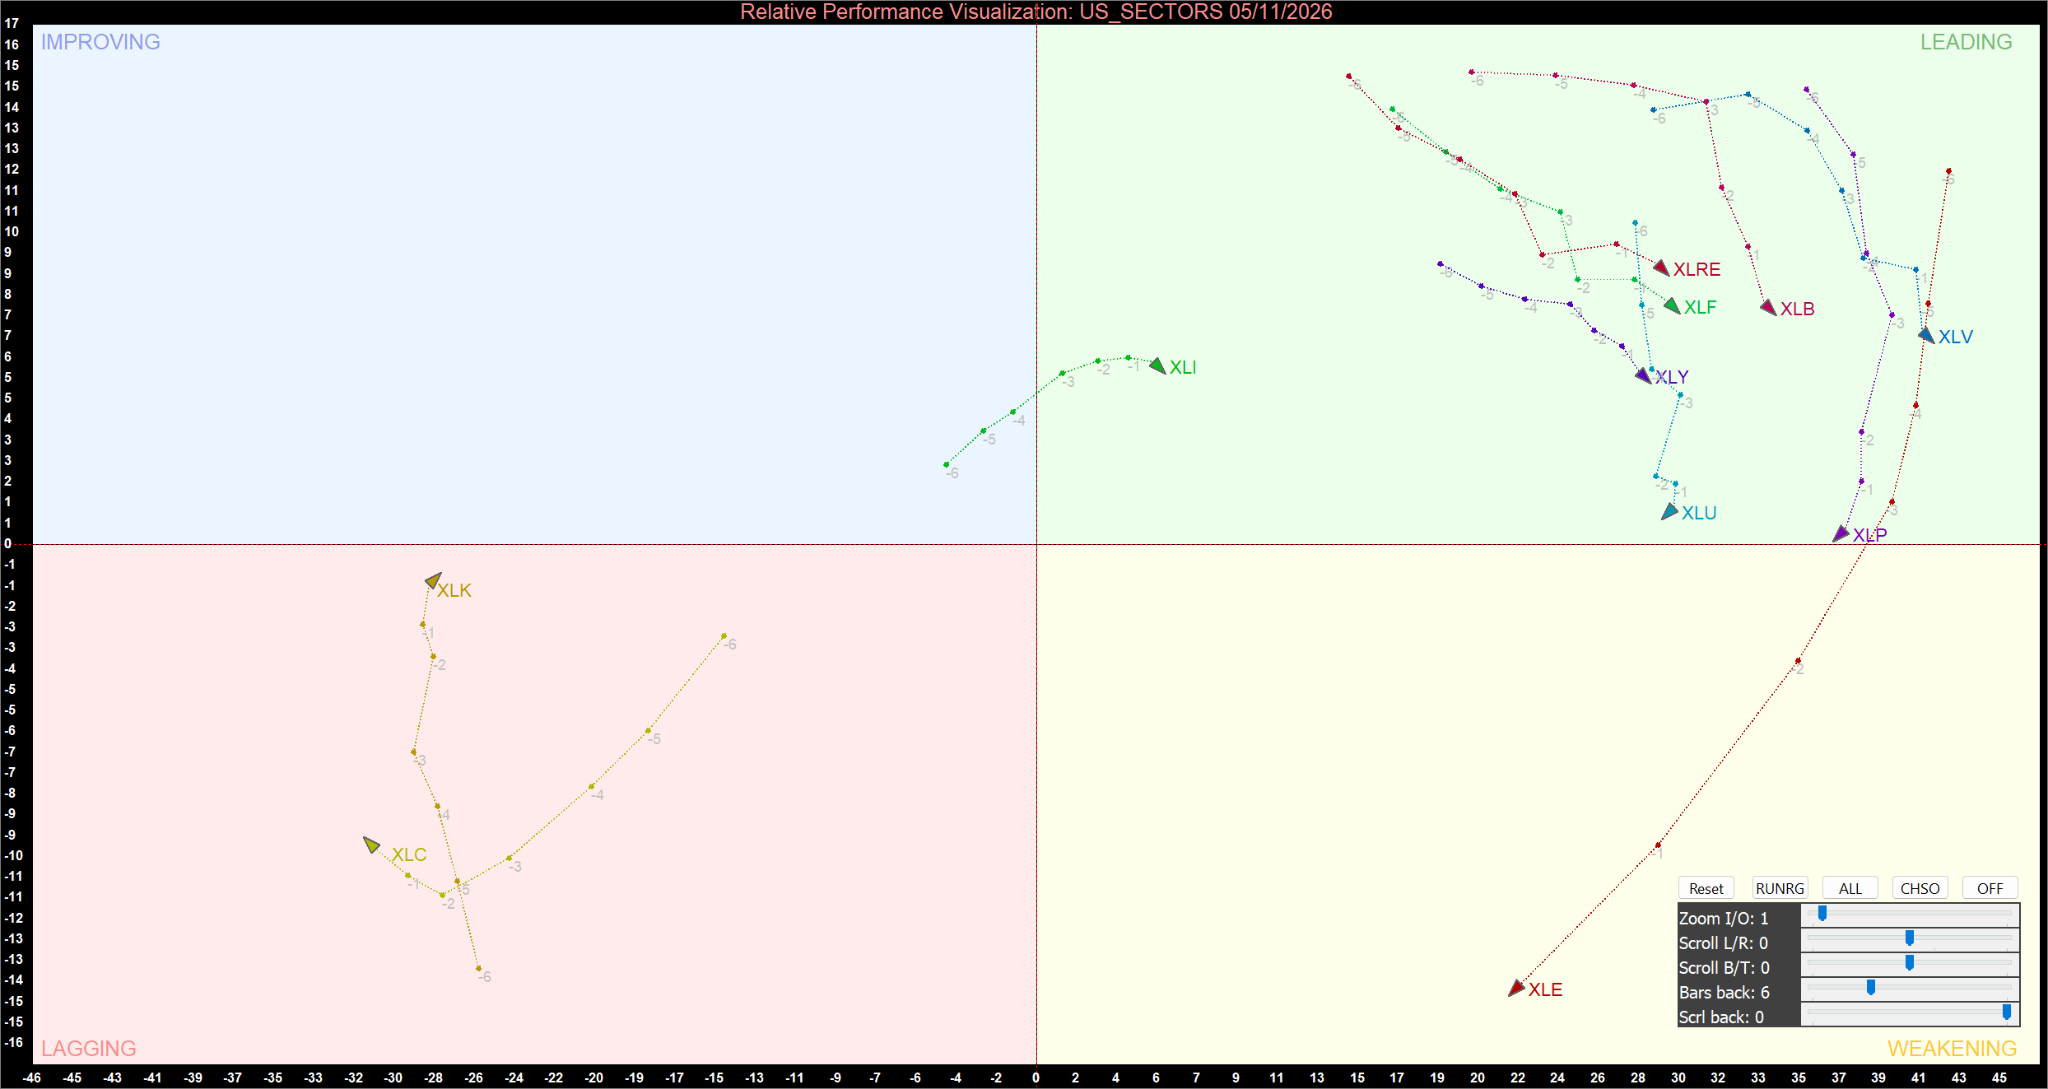
US Sector Relative Momentum Chart (at the closing price of 05/11/2026). Powered by: amibroker.com.
Eight Sectors Maintain Leading Positions
Eight of the eleven sector ETFs are positioned in the Leading quadrant, making this the dominant feature of the latest chart. Real Estate (XLRE), Financials (XLF), Materials (XLB), Health Care (XLV), Consumer Discretionary (XLY), Utilities (XLU), Consumer Staples (XLP) and Industrials (XLI) all have endpoints above the horizontal axis and to the right of the vertical axis. This Placement indicates that each sector is demonstrating positive relative strength and positive momentum against the benchmark.
The leaders are not clustered at identical levels. Materials and Health Care are positioned towards the right side of the Leading quadrant, while Real Estate and Financials are also located firmly in the upper-right region. Consumer Discretionary remains above the horizontal boundary, and Industrials is positioned further left but clearly above and to the right of both central axes. Utilities and Consumer Staples are closer to the horizontal axis than several other leaders, making their quadrant status comparatively more sensitive to any further loss of momentum.
The plotted trails show that sector positioning has evolved over the six-period look-back rather than moving in a straight line. Some paths have curved or changed direction, demonstrating fluctuations in relative strength and momentum. The latest endpoint, rather than the direction of an earlier segment alone, determines the current quadrant classification. Continued positioning above both central axes would support the persistence of leadership, while a move below the horizontal axis would indicate a transition into Weakening if relative strength remained positive.
Energy Remains in Weakening
Energy (XLE) is positioned in the lower-right quadrant, indicating positive relative strength but negative momentum. Its latest endpoint is well below the horizontal axis while remaining to the right of the vertical axis. This configuration places the sector in Weakening: it continues to hold a positive relative-strength reading, but its momentum is below the benchmark's zero line. The distance below the horizontal axis indicates that the negative momentum reading is more pronounced than a marginal boundary position.
A recovery above the horizontal axis, while maintaining positive relative strength, would return Energy to Leading. Conversely, a move to the left of the vertical axis would signal deterioration in relative strength and place the sector in Lagging if momentum remained negative. The next RRG readings will therefore be important in determining whether the current weakening phase stabilises or develops into broader relative underperformance.
Technology and Communication Services Remain Lagging
Technology (XLK) and Communication Services (XLC) occupy the Lagging quadrant. Both endpoints are positioned below the horizontal axis and to the left of the vertical axis, indicating negative momentum and negative relative strength. Communication Services is located deeper in the lower-left region, with a particularly weak relative-strength position and a more negative momentum reading. Technology is also within Lagging, although its endpoint is closer to the horizontal boundary than Communication Services.
The trails show movement during the displayed period, but neither sector has crossed into Improving at the latest endpoint. A move above the horizontal axis while remaining left of the vertical axis would provide the first indication of improving momentum and would shift either sector into Improving. A subsequent move to the right of the vertical axis would be required to establish positive relative strength and enter Leading. Until then, both sectors remain the chart's laggards.
Market Momentum Outlook
The current RRG configuration is positive in breadth, with eight sectors in Leading and only three outside that quadrant. However, the absence of any sector in Improving means that neither the lagging groups nor the weakening sector has established a clear positive-momentum recovery at the latest plotted points. Energy's Weakening position and the Lagging status of Technology and Communication Services remain the principal areas of relative weakness. Within Leading, Utilities and Consumer Staples are closer to the horizontal boundary, so their momentum classifications Warrant monitoring. Further movement away from the central axes would strengthen the case for persistent leadership, while crossings of either axis would signal a change in relative positioning. The RRG describes relative technical momentum and strength; it does not, by itself, establish fundamental conditions or forecast absolute returns.
Bottom Line
The US sector momentum chart for 5 November 2026 shows eight sectors in Leading: Real Estate, Financials, Materials, Health Care, Consumer Discretionary, Utilities, Consumer Staples and Industrials. Energy remains in Weakening, while Technology and Communication Services are in Lagging. No sector is positioned in Improving at the latest plotted point. The broad concentration in Leading indicates positive relative momentum across most sectors, but the persistent weakness in Technology and Communication Services and the deterioration in Energy demonstrate that leadership remains uneven. Subsequent RRG readings will help determine whether the current leaders retain their positions and whether the weaker sectors begin to recover.


 Nov 12, 2026





 Please wait processing your request...