
 CA
 NZ
 UK
 US
 IND

 AU

 Share
 X (Formerly Twitter)
 Whatsapp
 Facebook
 LinkedIn
 Telegram
 Email This Article
 Copy Link
 Summarize with AI
 Chat GPT
 Perplexity

Key Highlights
- The "North-West" Anomaly: Eight out of the eleven sectors are hooking in a synchronized North-West direction, indicating a broad-based attempt to gain vertical momentum while simultaneously bleeding relative strength against the S&P 500.
- Energy’s Gravitational Pull: Energy (XLE) continues to push to the extreme right of the Leading quadrant. Its massive outperformance is mathematically skewing the benchmark, forcing the rest of the market's relative strength to point leftward.
- Materials Break from the Pack: Materials (XLB) is the only sector (outside of Energy) actively gaining both momentum and relative strength, confirming a highly concentrated cyclical bid in raw materials.
- Financials Stall: After breaking into the Leading quadrant, Financials (XLF) has abruptly hooked left, struggling to maintain its relative strength parity.
- Tech’s Uninterrupted Slide: Information Technology (XLK) remains the most structurally broken chart on the board, plunging South-West deeper into the Weakening quadrant with no signs of a bottom.
The US sector rotation on March 31, 2026, paints a picture of a deeply skewed market. As the momnetum chart illustrates, the extreme, singular dominance of the Energy sector is actively distorting the relative performance of the entire broader market. Capital is attempting to broaden out, as evidenced by the upward momentum hooks across the Lagging and Improving quadrants, but nothing can match the sheer relative strength of the commodity space.
Daily US Sector Momentum Summary
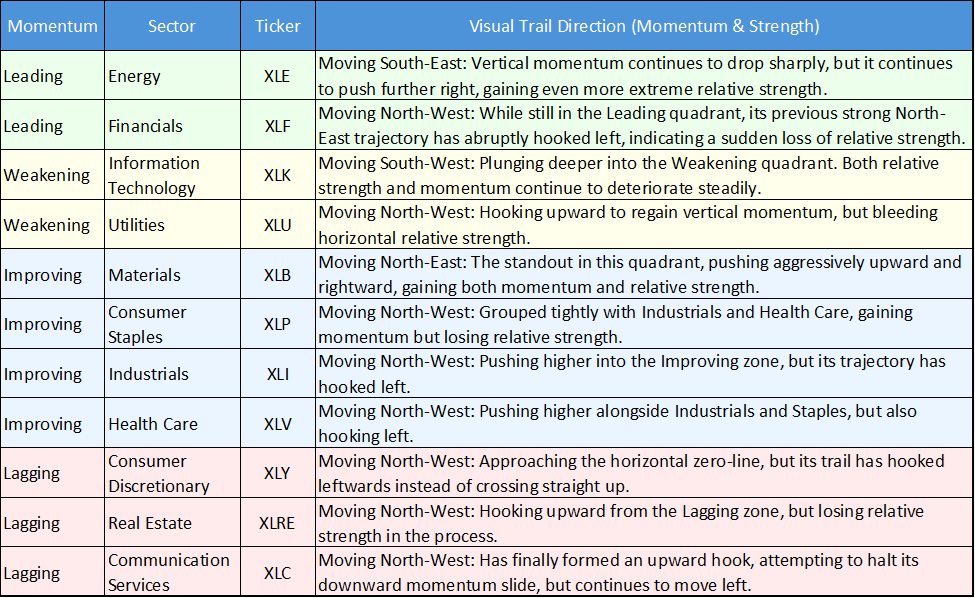
The following table categorizes all 11 sectors into their confirmed RRG quadrants based on their precise visual trajectories:
Daily US Sector Relative Momentum Chart – 31/03/2026
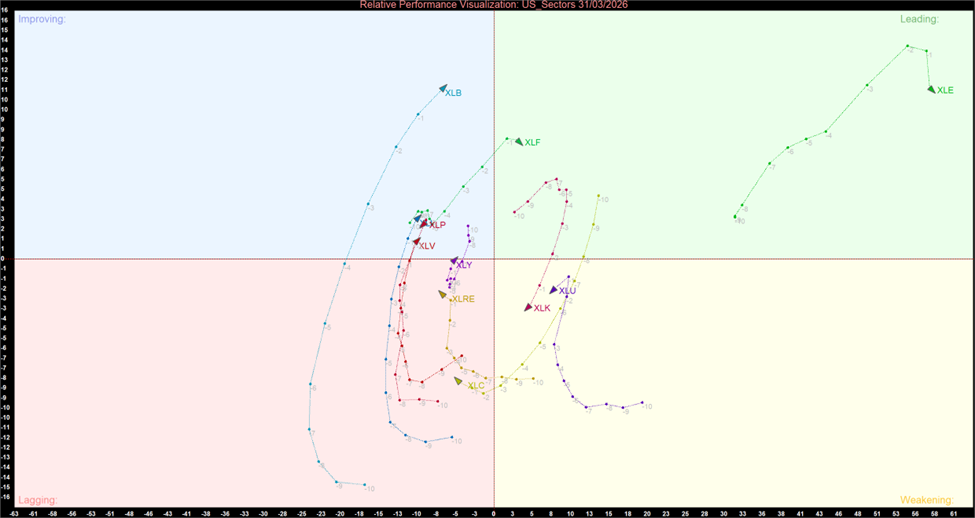
US Sector Relative Momentum Chart (at the closing price of 31th March 2026). Powered by: amibroker.com
Daily US Sector Momentum Summary Table
Key Market Themes
The Synchronized "North-West" Drift
The most glaring visual on this chart is the massive, synchronized leftward hook across the market. Eight sectors are pointing strictly North-West. In RRG terms, this means the broader market is trying to build positive vertical momentum (moving North) but is universally losing horizontal relative strength (moving West). This occurs when one singular sector—in this case, Energy—is performing so strongly that it mathematically pulls the S&P 500 benchmark average higher, leaving everything else looking relatively weak by comparison.
Materials Stand Alone
Amidst the sea of North-West hooks, Materials (XLB) is the standout anomaly. Pointing aggressively North-East, it is the only sector actively gaining both momentum and relative strength outside of the Energy complex. This confirms that the current market bid is highly concentrated. Investors are not buying a broad economic recovery; they are specifically accumulating raw materials, industrial metals, and hard assets to hedge against inflation and supply chain constraints.
Financials Lose Their Footing
In the previous session, Financials (XLF) broke into the Leading quadrant, suggesting a robust rotation into value and yield-sensitive equities. Today, that narrative hit a speed bump. XLF's trajectory abruptly hooked North-West. While it remains a market leader, its inability to maintain relative strength parity with commodities suggests investors are still hesitant to fully commit to the banking sector while macroeconomic uncertainty remains elevated.
Bottom Line
The momentum landscape as of March 31 remains entirely dictated by Energy's gravitational pull. The broader market is making a concerted effort to catch a bid—evidenced by the widespread upward momentum hooks—but until Technology finds a definitive floor or the commodity rally significantly cools, the S&P 500 will remain a highly bifurcated, difficult environment for stock pickers outside of the hard asset space.


 Nov 12, 2026





 Please wait processing your request...