
 CA
 NZ
 UK
 US
 IND

 AU

 Share
 X (Formerly Twitter)
 Whatsapp
 Facebook
 LinkedIn
 Telegram
 Email This Article
 Copy Link
 Summarize with AI
 Chat GPT
 Perplexity

Aeris Resources Limited (ASX: AIS) engages in the production, sale, and exploration of copper, zinc, gold, and silver in Australia, whose primary operating assets include the Tritton Copper Operations and Cracow Gold.
On 30 April 2024, AIS unveiled its Q3 FY24 update and ended the quarter with closing cash and receivables of AUD 28.3mn, and with cash of AUD 19.4mn. The Group copper equivalent production stood at 9.1kt in 3QFY24. The copper production at Tritton was impacted by labour and equipment availability. However, contract labour and additional equipment is now in place to lift production in Q4. Subsequently, the copper guidance for FY24 has been maintained at 19kt – 24kt.
Technical View: In March 2024, AIS' stock price broke above a long-term downward slope trendline on the daily chart a, indicating a positive trend. Since then, the stock has been creating higher peaks and higher troughs, indicating that the short-term uptrend remains intact. Additionally, the RSI (14-period) is heading north from the midpoint, providing further support for the previous analysis. Prices are fluctuating between its previous peak and trough, which may potentially function as dynamic resistance and support levels for the stock, respectively. Important support for the stock is positioned at AUD 0.265, while significant resistance is placed at AUD 0.310.

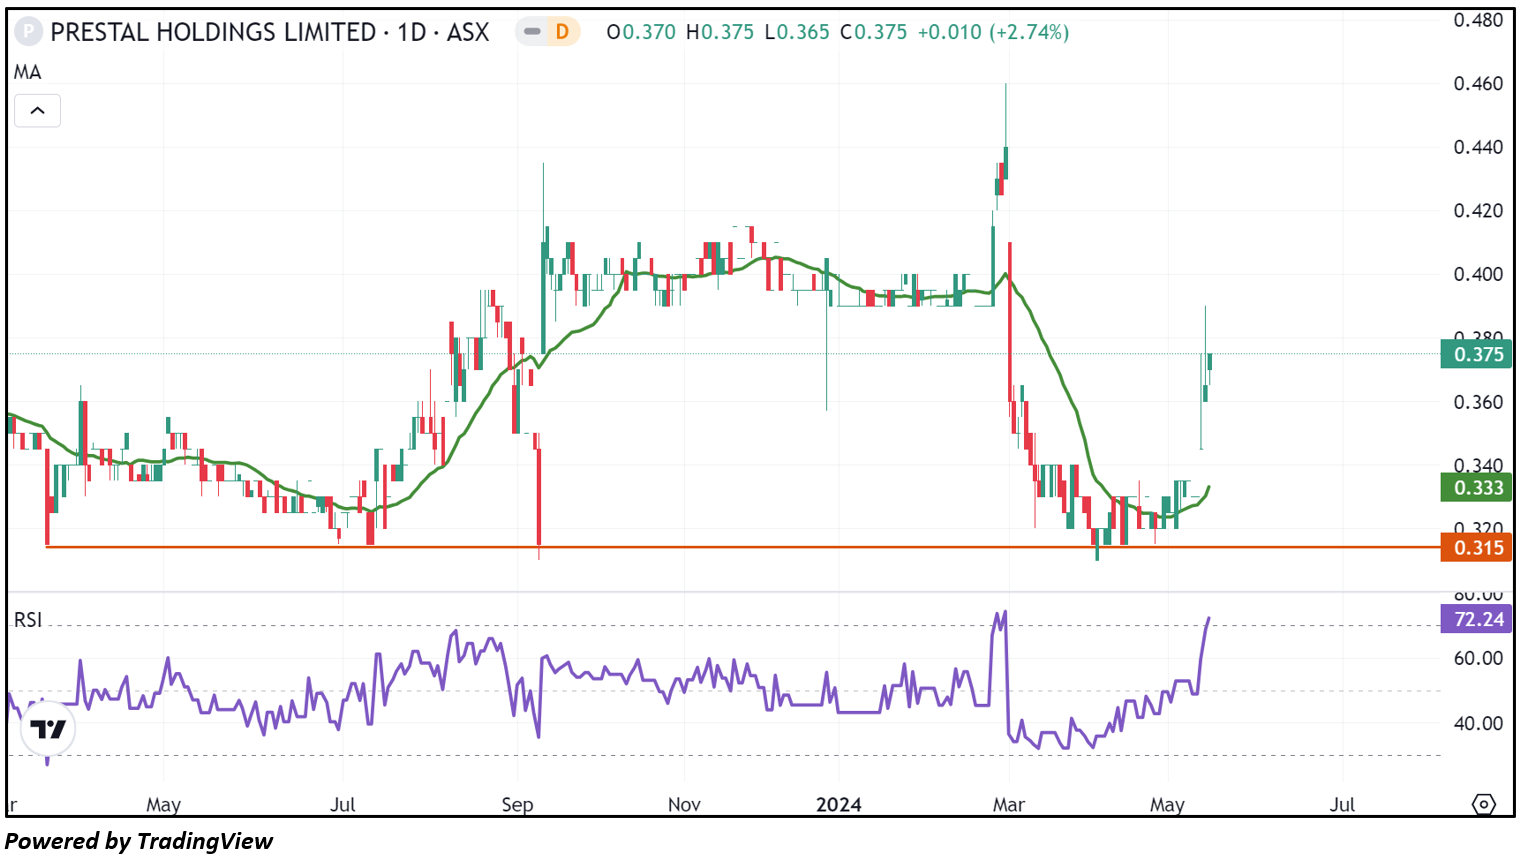
Prestal Holdings Limited (ASX: PTL) manufactures, markets, and distributes personal, household, and commercial products in Australia, New Zealand, and Asia, operating through Owned Brands, Contracted Brands, and Hampers with Bite segments.
Prestal Holdings Limited (ASX: PTL) reported AUD 16.8mn in sales revenue, down 15.7% YoY, with underlying EBITDA at AUD 3.4mn (down 6.4% YoY) and underlying NPAT at AUD 2.1mn (down 4.1%) in 1HFY24 ended 31 December 2023. The company held AUD 62.1mn in cash at the end of the period. With the sale of its consumer products business in the first half, Prestal shifted focus to e-commerce. The company maintains a positive outlook for its Hampers with Bite business. Future plans include rebranding, product expansion, website enhancement, and strategic acquisitions.
Technical View: On the daily chart, PTL's stock price is rebounding from the lower boundary of a trading range characterised by identical highs and lows, suggesting that the current short-term rally in the stock might continue to remain in place. Additionally, the RSI (14-period) is heading north from the midpoint, providing further support for the mentioned recommendation. Prices are fluctuating between its previous peak and trough, which may potentially function as dynamic resistance and support levels for the stock, respectively. Critical support for the stock is positioned at AUD 0.345, while key resistance is placed at AUD 0.410.
Note 1: How to Read the Charts?
The Green colour line reflects the 21-period moving average while the red line indicates the 50-period moving average. SMA helps to identify existing price trends. If the prices are trading above the 21-period and 50-period moving average, then it shows prices are currently trading in a bullish trend.
The Black colour line in the chart’s lower segment reflects the Relative Strength Index (14-Period) which indicates price momentum and signals momentum in trend. A reading of 70 or above suggests overbought status while a reading of 30 or below suggests an oversold status.
The Blue colour bars in the chart’s lower segment show the volume of the stock. The volume is the number of shares that changed hands during a given day. Stocks with high volumes are more liquid than stocks with lesser volume and liquidity in stocks helps in easier and faster execution of the order.
The Orange colour lines are the trend lines drawn by connecting two or more price points and used for trend identification purposes. The trend line also acts as a line of support and resistance.
Technical Indicators Defined: -
Support: A level at which the stock prices tend to find support if they are falling, and a downtrend may take a pause backed by demand or buying interest.
Resistance: A level at which the stock prices tend to find resistance when they are rising, and an uptrend may take a pause due to profit booking or selling interest.


 Nov 12, 2026





 Please wait processing your request...