
 CA
 NZ
 UK
 US
 IND

 AU

 Share
 X (Formerly Twitter)
 Whatsapp
 Facebook
 LinkedIn
 Telegram
 Email This Article
 Copy Link
 Summarize with AI
 Chat GPT
 Perplexity

Key Highlights
- Telix Pharmaceuticals continues to benefit from growing commercial adoption of its radiopharmaceutical products, supporting Revenue growth and strengthening its position in the precision oncology market.
- The company remains well positioned to capitalise on increasing global Demand for targeted cancer diagnostics and therapies, supported by product development and international expansion initiatives.
- The Daily Chart has now broken above the long-term descending Trendline that had constrained TLX since early 2025, strengthening the evidence of a medium-term trend reversal.
- TLX has also broken above the neckline of a potential Inverse Head & Shoulders pattern around $17.79, providing technical confirmation of the bullish formation.
- The completed pattern generates a measured upside target near $27.06, suggesting substantial potential upside if the breakout is sustained.
- The recent move to $17.79 represents an important technical milestone, although confirmation through continued trading above the neckline would strengthen the bullish outlook.
Telix Pharmaceuticals Limited (ASX: TLX) is showing increasingly constructive technical conditions following an extended correction from its 2025 highs. The stock has now moved through both the long-term descending trendline and the key neckline resistance associated with an Inverse Head & Shoulders formation. This combination represents a significant improvement in the technical structure and suggests that a medium-term Reversal may be underway.
The technical improvement is supported by Telix's position within the rapidly expanding radiopharmaceutical industry. Growing demand for precision cancer diagnostics and targeted therapies, together with continued commercial adoption and international expansion, provides a supportive fundamental backdrop for the longer-term outlook.
Improving Industry Tailwinds Support Long-Term Growth
After undergoing an extended correction since early 2025, Telix Pharmaceuticals has shown a substantial improvement in price structure. The company remains well positioned within the growing radiopharmaceutical industry, benefiting from increasing adoption of precision medicine and targeted cancer therapies.
Continued commercial expansion, growing product adoption and progress across its clinical pipeline have helped maintain investor interest. The combination of these industry tailwinds and the recent technical breakout could provide a stronger foundation for a sustained recovery.
Expanding Radiopharmaceutical Market
- Growing demand for targeted diagnostic imaging and cancer therapies continues to support the long-term outlook for the radiopharmaceutical sector. Telix is well positioned to benefit through its established products and expanding development pipeline.
Commercial Revenue Growth
- Increasing adoption of the company's approved products across major healthcare markets continues to drive revenue growth, providing stronger Cash Flow to support future development initiatives.
Pipeline Development and International Expansion
- Telix continues advancing multiple clinical programs while expanding its global presence. Positive trial results, regulatory approvals, and broader market penetration could provide significant growth opportunities over the coming years.
Associated Risks
Despite its attractive growth profile, Telix remains exposed to several risks. Biotechnology and pharmaceutical companies face regulatory uncertainty, and delays in approvals or unexpected clinical trial outcomes could negatively affect investor sentiment and future Earnings expectations.
The company also operates in a highly competitive environment, with larger pharmaceutical groups continuing to invest heavily in radiopharmaceutical technologies. In addition, growth-oriented healthcare valuations remain sensitive to changes in interest rates and broader Market Risk appetite.
Technical Outlook
TLX has strengthened significantly, with the latest chart showing a confirmed breakout above both the long-term descending trendline and the Inverse Head & Shoulders neckline.
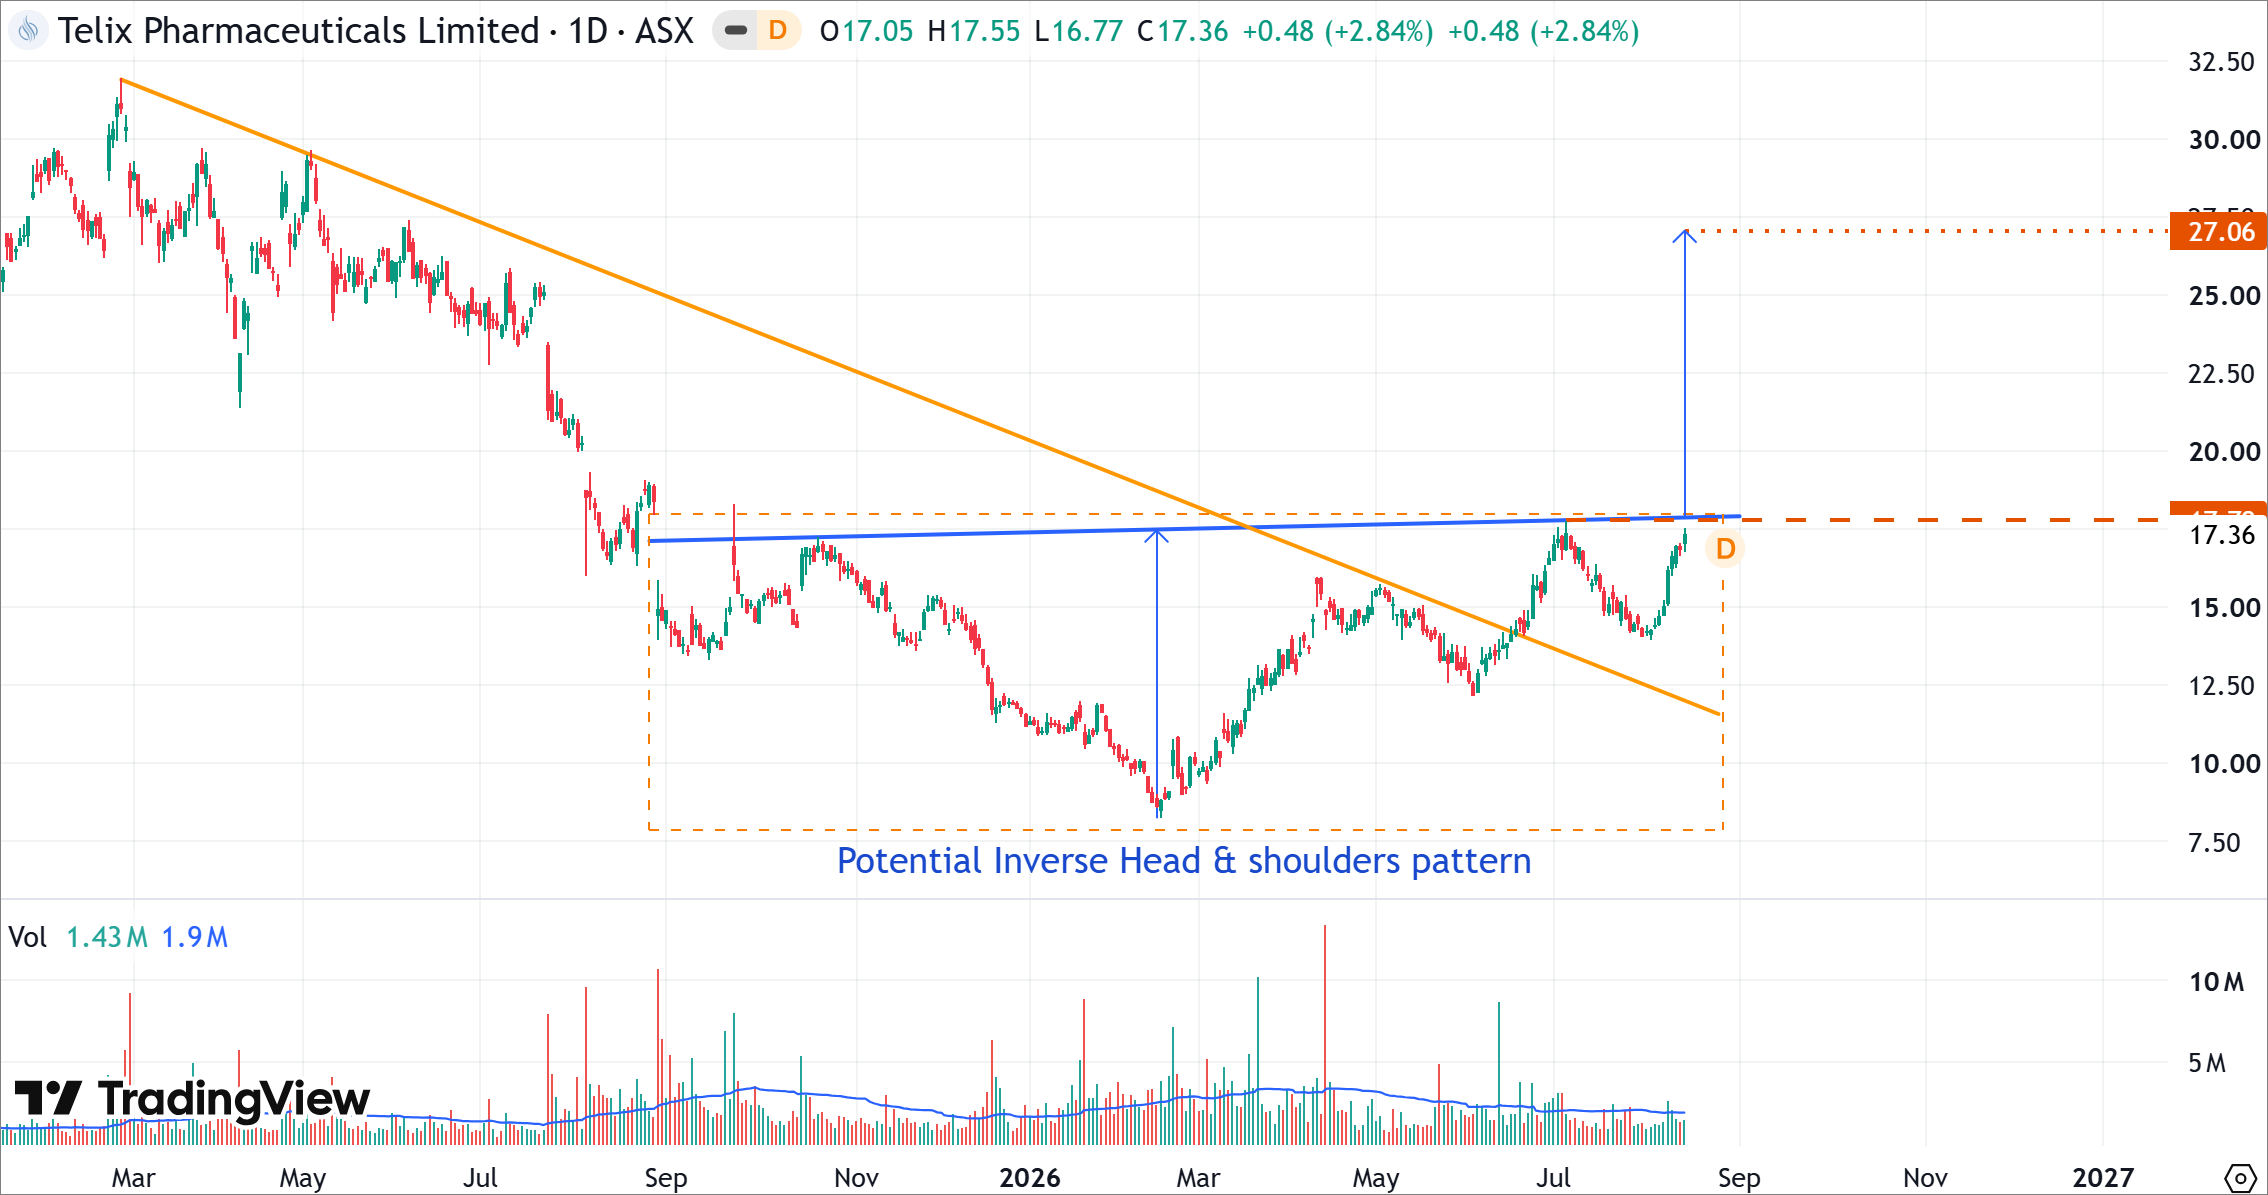
TLX's Daily Price Chart (at the closing price of 13/08/2026). Powered by: tradingview.com
- On the daily chart, TLS has formed a potential Inverse Head & Shoulders formation, with the neckline positioned around $17.79. The latest price action has pushed through this resistance zone, providing confirmation of the bullish reversal pattern.
- The measured-move calculation from the pattern projects an upside target near $27.06. This target is derived from the height of the Inverse Head & Shoulders formation and represents the potential medium-term objective if the breakout remains intact.
- The breakout is therefore an important technical development for TLX. A sustained close above the $17.79 neckline would strengthen the confirmation, while continued buying interest could open the way toward the $27.06 measured target.
Bottom Line
Telix Pharmaceuticals Limited (ASX: TLX) is showing a significant improvement in its medium-term technical outlook. The stock has broken above the long-term descending trendline and moved through the neckline of an Inverse Head & Shoulders formation, signalling a potential transition from a prolonged downtrend into a new recovery phase.
The fundamental backdrop remains supportive, with Telix benefiting from growing demand for radiopharmaceutical products, commercial expansion and opportunities across the precision oncology market. These factors provide a constructive foundation for the technical recovery.
The key level to watch is now the $17.79 neckline, which has shifted from major resistance toward an important potential support level. If TLX can sustain its breakout above this zone, the Inverse Head & Shoulders pattern projects a measured upside target near $27.06. A successful retest of $17.796 would provide additional confirmation, while a sustained move back below the neckline would weaken the bullish setup.


 Nov 12, 2026





 Please wait processing your request...