
 CA
 NZ
 UK
 US
 IND

 AU

 Share
 X (Formerly Twitter)
 Whatsapp
 Facebook
 LinkedIn
 Telegram
 Email This Article
 Copy Link
 Summarize with AI
 Chat GPT
 Perplexity

Key Highlights
- Saturn Metals is advancing the Apollo Hill Gold Project in Western Australia.
- The company's Apollo Hill resource provides exposure to a significant gold development opportunity.
- STN's Daily Chart has confirmed an Inverse Head & Shoulders pattern after breaking above the $0.50 neckline.
- The stock subsequently advanced to $0.555, confirming strong follow-through after the breakout.
- The bullish pattern projects an initial upside target around $0.665, with a broader target near $0.695.
- The former $0.50 neckline has become an important support level.
- Rising trading Volume accompanying the breakout strengthens the bullish technical signal.
Saturn Metals Ltd (ASX:STN) is showing improving technical momentum following the confirmed breakout from an Inverse Head & Shoulders pattern. The stock has decisively moved above the $0.50 neckline and subsequently advanced to $0.555, indicating strong buying interest. The breakout has shifted the technical outlook from a potential bullish Reversal to an established bullish setup.
Apollo Hill Growth Opportunity
Saturn Metals' fundamental Investment case is centred on the Apollo Hill Gold Project in Western Australia. The project provides the company with exposure to gold exploration and development, while continued resource and exploration activity could provide further catalysts for the stock.
The company's growth outlook is supported by the potential to expand and improve the Apollo Hill resource through ongoing exploration. Further drilling success and progress toward development could strengthen the long-term investment case.
However, Saturn remains exposed to the risks associated with gold exploration and mine development. Project execution, exploration results, resource conversion, development costs and movements in the gold price could all influence the company's future performance.
Associated Risks
Saturn remains exposed to the risks associated with gold exploration and development, including exploration outcomes, resource conversion, project costs and execution. The company's valuation is also sensitive to movements in the gold price and broader investor sentiment toward gold developers.
From a technical perspective, the bullish setup could weaken if STN fails to hold above the former $0.50 neckline. A decisive move back below this level could signal a failed breakout and increase the likelihood of renewed consolidation.
Technical Outlook
STN's daily chart has confirmed the bullish Inverse Head & Shoulders pattern after decisively breaking above the $0.50 neckline, signalling potential further upside.
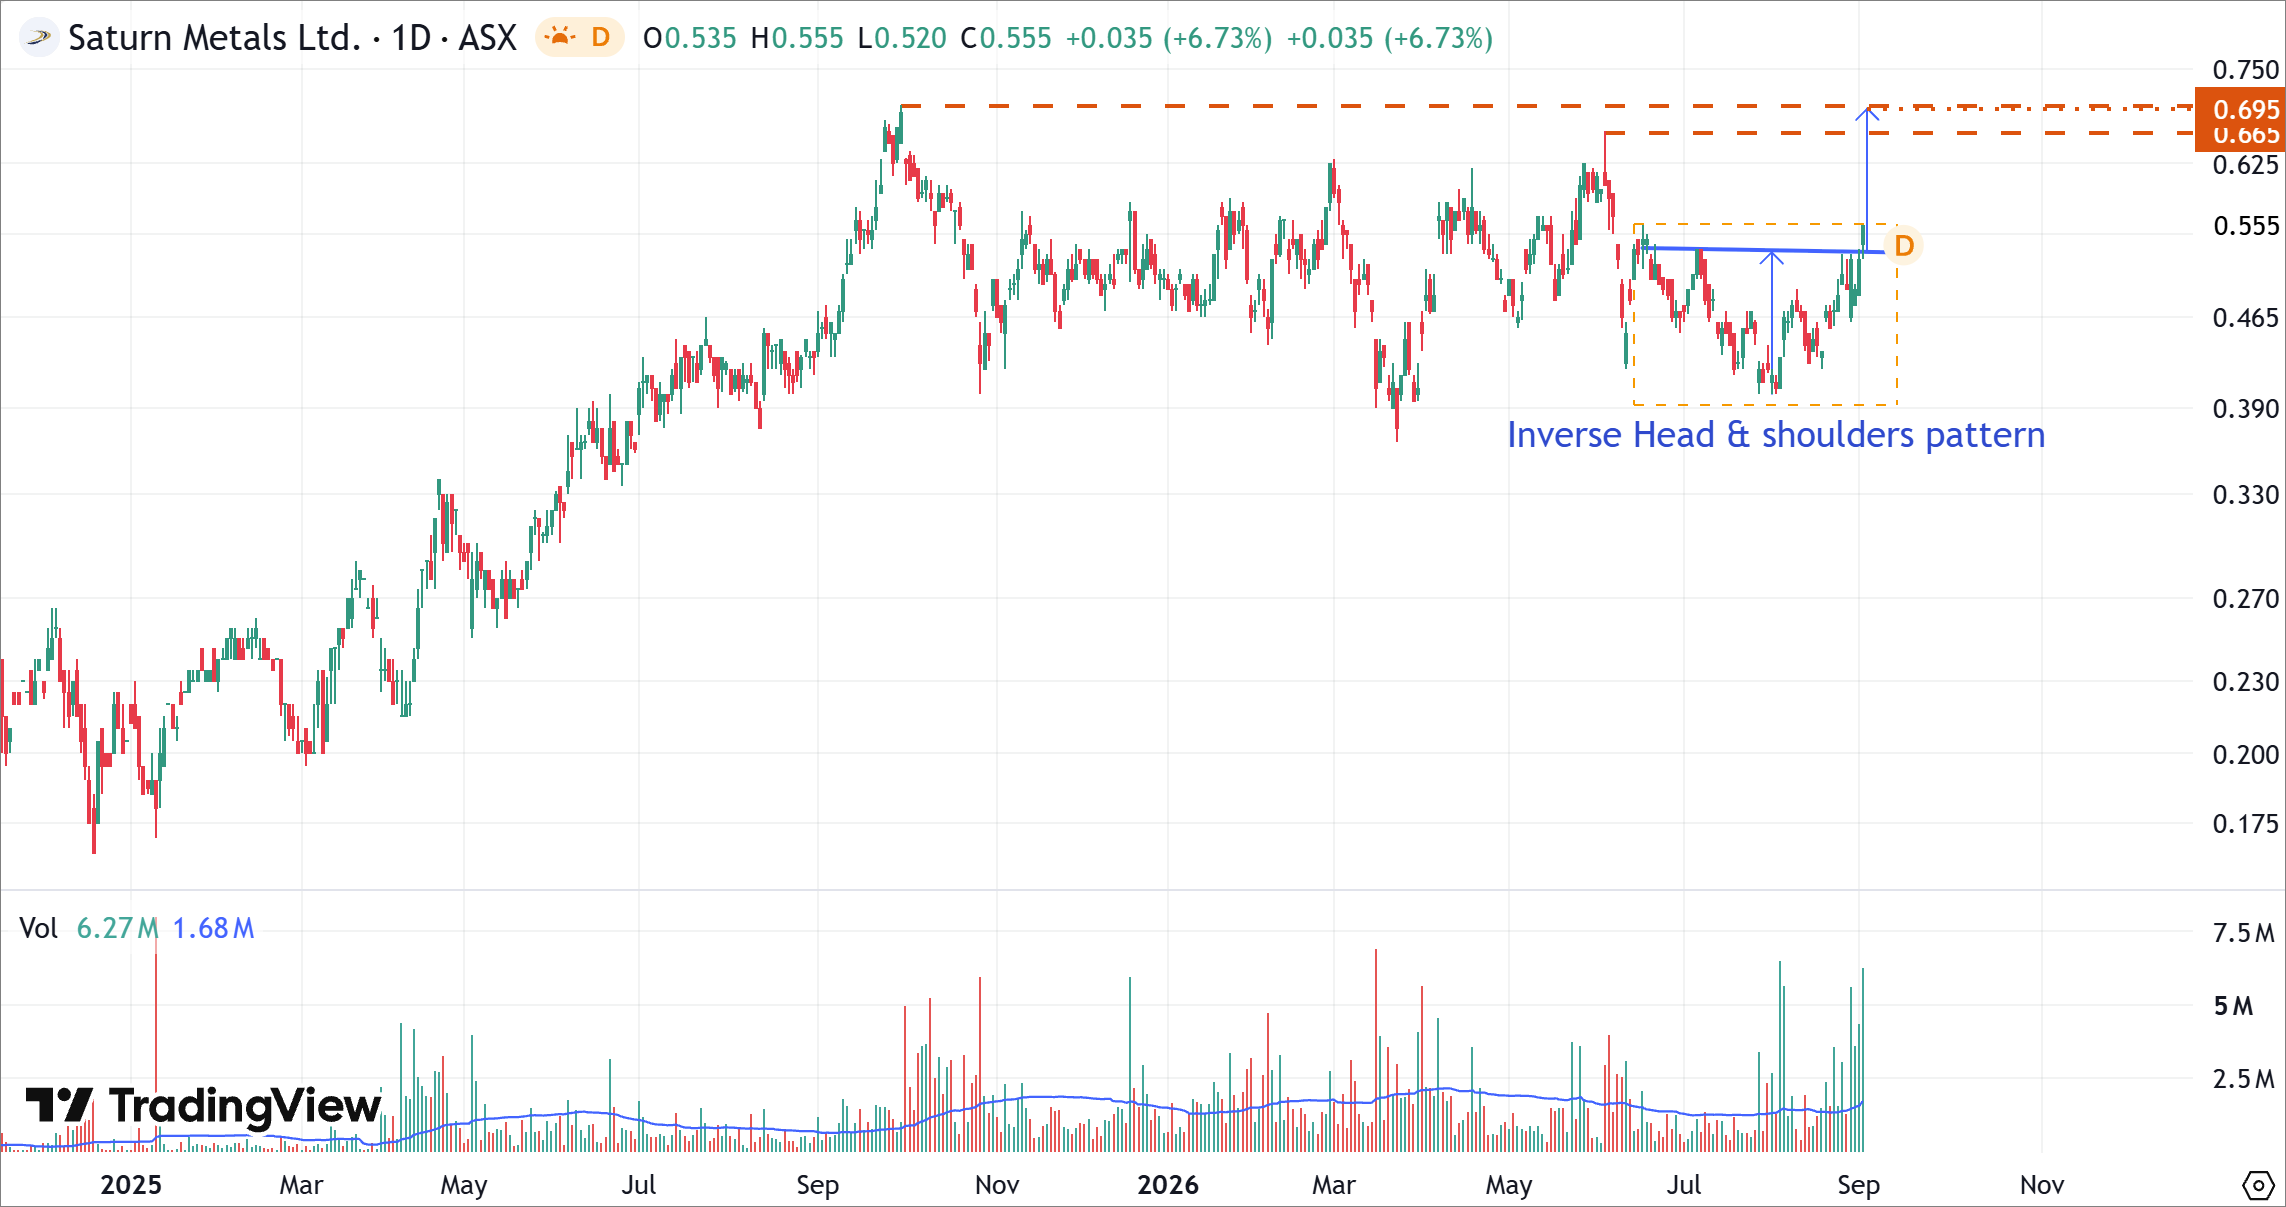
STN's Daily Price Chart (at the closing price of 02/09/2026). Powered by: tradingview.com.
- The Inverse Head & Shoulders pattern developed following an extended consolidation phase, with the left shoulder, head and right shoulder forming across the chart.
- The $0.50 neckline has already been decisively breached, confirming the bullish reversal pattern.
- STN has subsequently advanced to $0.555, demonstrating strong follow-through after the breakout.
- The latest advance is accompanied by increased trading volume, strengthening the validity of the bullish breakout.
- The measured move shown on the chart indicates an initial upside target around $0.665, while the broader target is near $0.695.
- The former $0.50 neckline should now act as an important support level.
- A sustained move above $0.50 would maintain the bullish structure, while a decisive reversal below this level could indicate a failed breakout.
- Continued strength above the neckline would keep the focus on the $0.665-$0.695 target zone.
Bottom Line
Saturn Metals (ASX:STN) has shifted to a more bullish technical outlook following the confirmed Inverse Head & Shoulders breakout above $0.50. The subsequent move to $0.555, accompanied by stronger volume, indicates solid buying momentum.
The confirmed pattern points toward the $0.665-$0.695 target zone, while $0.50 has become the key support level. As long as STN remains above the former neckline, the bullish technical structure remains intact, although continued monitoring of the breakout and gold-market conditions remains important.


 Nov 12, 2026





 Please wait processing your request...