
 CA
 NZ
 UK
 US
 IND

 AU

 Share
 X (Formerly Twitter)
 Whatsapp
 Facebook
 LinkedIn
 Telegram
 Email This Article
 Copy Link
 Summarize with AI
 Chat GPT
 Perplexity

- A forward dividend yield of approximately 5.6% to 5.8% remains a key pillar for income-focused portfolios.
- The group maintains a highly diversified portfolio of 61 farming properties valued at approximately $2.0 billion.
- Full-year distribution guidance for FY26 has been reaffirmed at 11.73 cents per unit.
- Management is actively recycling capital through asset divestments to reduce gearing.
The narrative for Rural Funds Group (ASX:RFF) has reached a significant turning point in early 2026. After a long period of consolidation where the stock traded at a substantial discount to its $3.10 Adjusted Net Asset Value (NAV), the daily chart has finally staged a structural breakout. This price action provides the technical confirmation that aligns with the firm’s steady fundamental performance and long-term leasing strategy.
Stable Yield and Asset Appreciation
RFF continues to operate as a reliable income generator, with recent financial results highlighting the organic growth embedded in its portfolio:
- Income Growth: Financial results for the first half of FY26 showed a 6.8% increase in net property income, reaching $48.6 million.
- Lease Security: The portfolio boasts a Weighted Average Lease Expiry (WALE) of 13.2 years, anchored by high-quality institutional tenants like JBS Australia and Olam.
- Strategic Development: Growth is being driven by "higher and better use" conversions, specifically the transformation of grazing land into high-yielding macadamia orchards and irrigated cropping.
Associated Risks
While the yield is attractive, investors must monitor RFF's debt levels, as high gearing remains a focal point for the market. Management is currently addressing this by selling non-core assets to fund ongoing developments and strengthen the balance sheet. Additionally, as a property-heavy REIT, the company’s valuation remains sensitive to fluctuations in rural land prices and broader interest rate movements.
Technical Outlook
The technical setup for RFF has transitioned from a lengthy bottoming phase into a clear positive outlook.
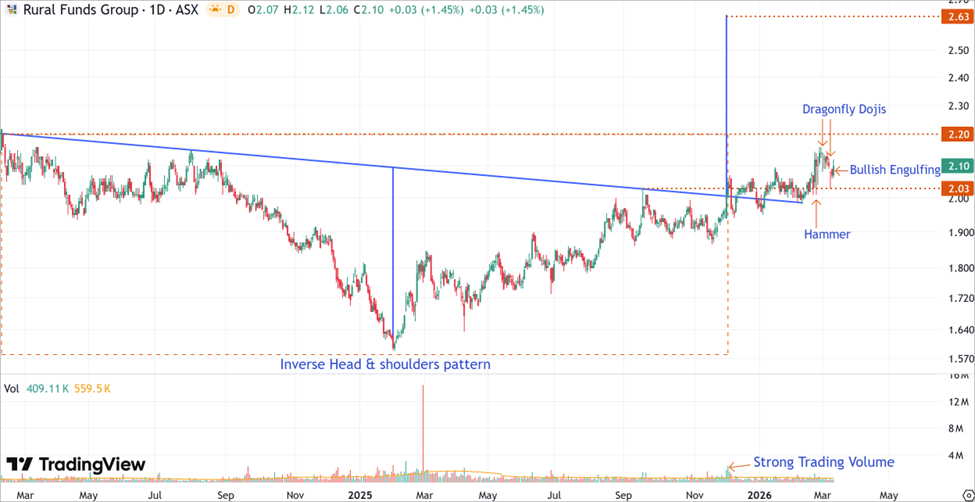
RFF’s Daily Price Chart (at the closing price of 11th March 2026). Powered by: tradingview.com
- On 01 December 2025, RFF’s stock price broke above the neckline of a large-scale Inverse Head and Shoulders pattern dating back to February 2024. This breakout, supported by a surge in trading volume, signaled a significant trend reversal from bearish to bullish.
- Following a minor pullback, the stock has recently generated a cluster of positive signals, including a Hammer, two Dragonfly Dojis, and a Bullish Engulfing candle, while re-testing the pattern’s neckline. These indicators suggest that the breakout remains robust and the upward reversal is firmly intact.
- The pattern’s projected technical target is $2.63, though investors should anticipate potential selling pressure near a significant resistance level at the February 2024 peak of $2.20, which may trigger secondary pullbacks
Bottom Line
Rural Funds Group (ASX:RFF) has finally bridged the gap between its productive agricultural fundamentals and its market price. The technical breakout above the $2.03 level validates the thesis that the stock's deep discount to NAV was overextended. With a stable yield and a clear structural shift on the charts, the stock appears well-positioned to trend toward its long-term valuation targets.


 Nov 12, 2026





 Please wait processing your request...