
 CA
 NZ
 UK
 US
 IND

 AU

 Share
 X (Formerly Twitter)
 Whatsapp
 Facebook
 LinkedIn
 Telegram
 Email This Article
 Copy Link
 Summarize with AI
 Chat GPT
 Perplexity

Key Highlights
- RMD has completed a textbook inverse head and shoulders pattern, indicating that its prolonged downtrend may be coming to an end.
- The stock has broken above the neckline resistance near $29.60, confirming the bullish reversal pattern.
- A simultaneous breakout above a major descending trendline adds significant technical confirmation to the recovery thesis.
- The first technical target is $33.32, representing the measured move from the inverse head and shoulders pattern.
- A successful move above $33.32 could pave the way for a retest of the secondary resistance level at $34.14.
ResMed (ASX:RMD) may be entering a new phase following nearly a year of persistent weakness. After trending lower since reaching highs above $45 in 2025, the stock has recently completed a bullish inverse head and shoulders formation and broken through key resistance levels. The combination of improving price action, strong volume, and a decisive breakout suggests investors are beginning to reassess the company's medium-term outlook.
The Recovery Story
Over the past twelve months, ResMed has faced significant selling pressure, with the share price declining from the mid-$40s to below $26 during the first half of 2026. The prolonged correction was characterised by a series of lower highs and lower lows, reflecting persistent investor caution.
However, during the past several months the selling pressure began to fade. The stock established a base between approximately $25 and $30, forming a classic inverse head and shoulders pattern. The left shoulder developed in May, the head formed during the June lows, and the right shoulder emerged during late June as buyers gradually regained control.
This type of price structure often signals that a downtrend is losing momentum and that institutional accumulation is beginning to emerge. The recent breakout above neckline resistance suggests the balance of power has shifted from sellers to buyers.
The Associated Risks
While the technical picture has improved materially, several risks remain.
The breakout is still in its early stages, meaning confirmation through continued follow-through buying will be important. A failure to hold above the neckline near $29.60 could result in a retracement back into the prior trading range.
Healthcare stocks can also be sensitive to earnings revisions, reimbursement changes, regulatory developments, and shifts in market sentiment toward defensive growth sectors. Any deterioration in company fundamentals could weaken the emerging technical recovery.
Additionally, the stock remains well below its 2025 highs, meaning several layers of overhead resistance remain before a full trend reversal can be confirmed.
Technical Analysis Outlook
RMD's daily chart is displaying one of the strongest technical reversal setups seen since the stock entered its prolonged correction.
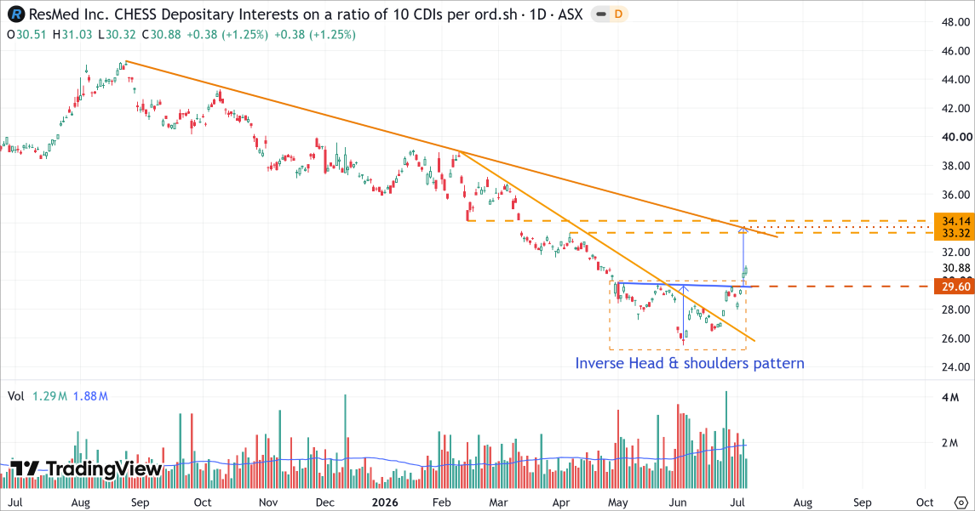
RMD’s Daily Price Chart (at the closing price of 06/07/2026). Powered by: tradingview.com
- On the daily chart, RMD’s stock price has completed an inverse head and shoulders pattern, providing the first bullish signal. More importantly, the stock has also broken above a major descending trendline that has defined the downtrend since August 2025. When a neckline breakout is accompanied by a trendline breakout, the probability of a meaningful trend reversal typically increases.
- The neckline of the inverse head and shoulders pattern is located near $29.60 and now serves as a critical support level. As long as the stock remains above this area, the bullish structure remains intact.
- Applying the traditional measured-move projection from the inverse head and shoulders pattern generates an initial upside target of approximately $33.32. This level also aligns with a significant resistance zone established during the February–March decline, making it an important objective for bullish investors.
Bottom Line
ResMed (ASX:RMD) appears to have completed an important technical reversal after spending nearly a year in a persistent downtrend. The successful breakout from an inverse head and shoulders pattern, combined with a move above long-term descending trendline resistance, suggests the correction phase may have finally run its course.
Technically, the stock now targets $33.32 as its first upside objective, with $34.14 representing the next major resistance level if momentum continues to build. While investors should remain mindful of the possibility of a failed breakout and broader market risks, the current chart structure indicates that the balance of probabilities has shifted in favour of a medium-term recovery.
For now, $29.60 remains the key level to watch, as holding above the neckline would keep the bullish reversal scenario firmly intact.


 Nov 12, 2026





 Please wait processing your request...