
 CA
 NZ
 UK
 US
 IND

 AU

 Share
 X (Formerly Twitter)
 Whatsapp
 Facebook
 LinkedIn
 Telegram
 Email This Article
 Copy Link
 Summarize with AI
 Chat GPT
 Perplexity

Key Highlights
- Sales in the North American market surged by 33.2%.
- Free cash flow conversion improved from 19.7% to 91.4%.
- Underlying NPAT increased by only 1.0%.
- Administration and employment costs increased by $6 million.
As Redox pivots toward its high-growth North American strategy, the price action on the daily chart is developing a bullish Inverse Head and Shoulders formation. We will now analyze the critical levels that could define the stock's next major move.
Transitioning Toward a North American Growth Narrative
- Redox Limited (ASX:RDX) is transitioning from a period of margin pressure toward a high-growth narrative centered on its aggressive expansion into the North American market. A key pillar of this fundamental turnaround is the company's vastly improved efficiency, highlighted by a surge in free cash flow conversion from 19.7% to 91.4% following a successful optimization of its inventory and supply chain.
- Furthermore, the strategic integration of acquisitions like Molekulis has bolstered its industrial sales, while a "fortress" balance sheet featuring $145 million in net cash and zero debt provides the financial flexibility to fund ongoing organic growth.
- This combination of geographic pivoting and enhanced capital management has begun to shift investor sentiment, reflected in a significant recovery of the share price from its recent lows.
Associated Risks and Challenges
- Despite its growth trajectory, Redox (ASX:RDX) faces a challenging global landscape characterized by margin compression and rising operational costs. While the company achieved a 6.6% increase in revenue, its underlying NPAT grew by only 1.0% in 1H26, pressured by a $6 million rise in operating expenses due to wage inflation and administrative overhead.
- Furthermore, as a global distributor, Redox remains highly sensitive to geopolitical tensions and shifting trade policies, which have previously caused fluctuations in its international business.
- The company must also manage the high working capital demands required to support its inventory-heavy model, alongside ongoing supply chain and logistics pressures that can impact overall profitability.
Technical Outlook
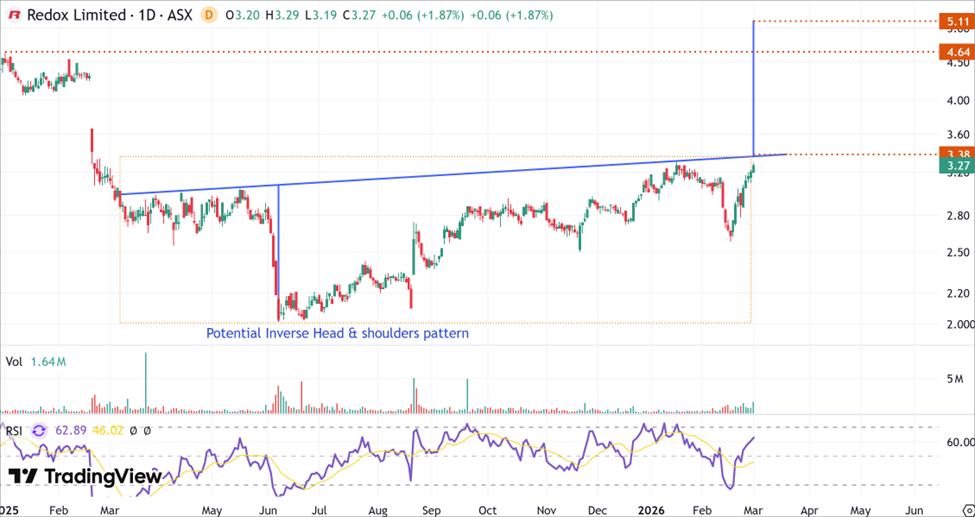
RDX’s Daily Price Chart (at the market price of 02nd March 2026). Powered by: tradingview.com
- Reflecting this transition story, RDX’s stock price is forming an Inverse Head and Shoulders pattern, though it has not yet completed.
- The immediate resistance is placed at the pattern’s neckline of $3.38. A decisive breakout above this significant level would suggest the stock may gain momentum to head higher.
- The pattern’s projected target is $5.11, which serves as the technical price objective, although selling pressure may appear near the resistance at $4.64—the January 2025 peak.
Bottom Line
- Redox Limited (ASX:RDX) is at a pivotal fundamental juncture as it shifts toward a high-growth narrative centered on its aggressive expansion into the North American market, where sales recently surged by 33.2%. This transition is supported by a dramatic improvement in operational efficiency, highlighted by a leap in free cash flow conversion to 91.4%, and a "fortress" balance sheet with $145 million in net cash. However, these gains are currently tempered by margin compression and rising operational costs, with underlying NPATFX growing by only 1.0%.
- Technically, the stock is carving out a bullish Inverse Head and Shoulders formation that mirrors this fundamental transition. While the outlook is improving, the pattern remains unconfirmed; a decisive breakout above the $3.38 neckline is required to unlock a technical move toward the $5.11 price objective. Investors should remain cautious of potential selling pressure near the $4.64 resistance level, representing the January 2025 peak.


 Nov 12, 2026





 Please wait processing your request...