
 CA
 NZ
 UK
 US
 IND

 AU

 Share
 X (Formerly Twitter)
 Whatsapp
 Facebook
 LinkedIn
 Telegram
 Email This Article
 Copy Link
 Summarize with AI
 Chat GPT
 Perplexity

Key Highlights
- REA Group continues to dominate Australia's online property advertising market, supported by the market-leading realestate.com.au platform, strong pricing power, and a highly scalable digital business model.
- The company remains well positioned to benefit from improving housing market activity, supported by stabilising interest rates, higher property listings and continued growth in digital property services.
- Technically, REA has completed a well-defined Inverse Head & Shoulders pattern, breaking decisively above the neckline resistance near $172.03 while simultaneously overcoming the long-term descending trendline, confirming a medium-term bullish reversal.
- The measured-move projection points to an initial upside target around $207.73, with intermediate resistance located near $180.95.
After several months of consolidation following a prolonged correction, REA Group Limited (ASX: REA) has confirmed a significant technical breakout. The stock has successfully completed a well-defined Inverse Head & Shoulders pattern by closing above both the neckline resistance near $172.03 and the descending trendline that had capped rallies since late 2025. Supported by improving buying momentum, the breakout suggests the medium-term recovery is gaining traction, with investors now focusing on higher technical objectives.
Outstanding Fundamentals
REA Group is Australia's leading online property marketplace and digital real estate services provider. Through realestate.com.au, the company enjoys a dominant market position, strong network effects and highly recurring revenue generated from residential and commercial property advertising.
- Market-Leading Digital Platform: REA continues to benefit from the dominant position of realestate.com.au, attracting Australia's largest audience of property buyers, sellers and agents.
- Recovery in Housing Activity: Stabilising interest rates and improving property transaction volumes could support higher listing activity and increased advertising expenditure from real estate agents.
- High-Margin Scalable Business Model: REA's asset-light digital platform generates strong cash flow, attractive operating margins and substantial earnings leverage as listing volumes recover.
- Long-Term Structural Growth: Continued investment in data analytics, mortgage broking, financial services and property technology provides additional growth opportunities beyond traditional listings.
Associated Risks
Despite the confirmed technical breakout, investors should remain aware of several key risks.
Although the Inverse Head & Shoulders pattern has now been confirmed, REA must maintain trading above the former neckline around $172.03, which should now act as an important technical support level. A sustained move back below this level would weaken the bullish outlook and increase the probability of a false breakout.
In addition, REA's earnings remain closely linked to Australian residential property activity. A slowdown in housing turnover, weaker listing volumes, declining advertising demand or deteriorating economic conditions could negatively affect revenue growth and profitability.
Furthermore, while the breakout has been accompanied by improving buying momentum, continued institutional accumulation would provide additional confidence that the emerging uptrend is sustainable.
Technical Outlook
REA's daily chart has confirmed an important bullish reversal following a decisive breakout from a well-defined Inverse Head & Shoulders pattern.
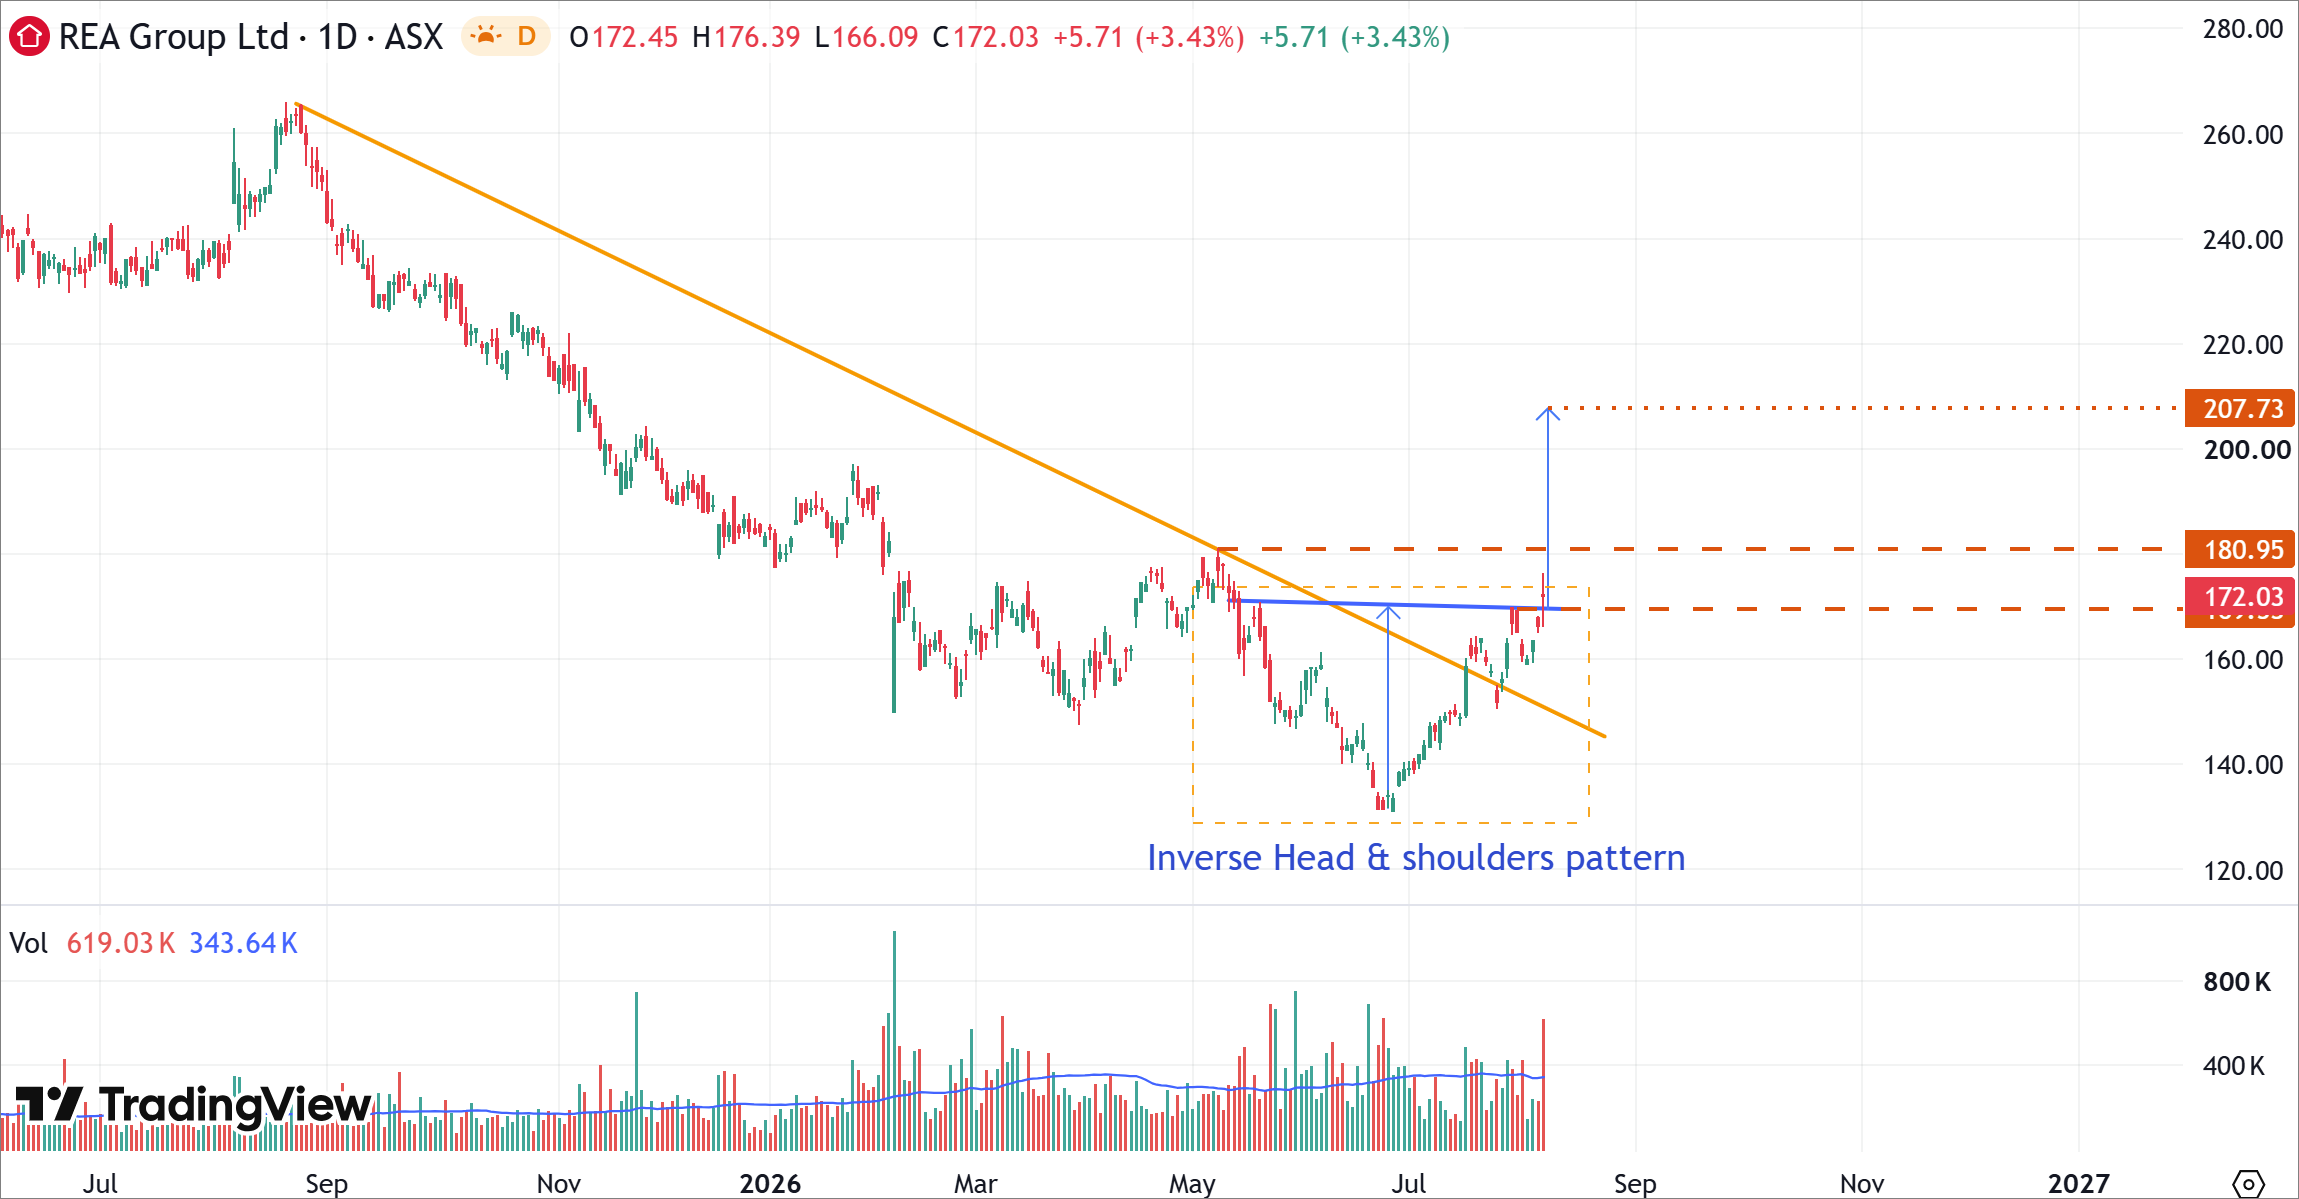
REA's Daily Price Chart (at the closing price of 06/08/2026). Powered by: tradingview.com.
- REA has completed a textbook Inverse Head & Shoulders formation after several months of consolidation, indicating that selling pressure has largely been absorbed and buyers have regained control of the medium-term trend.
- The stock has broken above the neckline resistance near $172.03, while simultaneously overcoming the descending trendline that had limited advances throughout the correction. This dual breakout significantly strengthens the technical outlook, with the former resistance now expected to act as key support.
- Applying the traditional measured-move projection from the Inverse Head & Shoulders pattern produces an initial upside objective near $207.73. Before reaching this target, the stock is likely to encounter intermediate resistance around $180.95. A sustained breakout above $180.95 would reinforce bullish momentum and open the way towards the full measured objective.
Bottom Line
REA Group Limited (ASX: REA) has materially strengthened its technical outlook after confirming a bullish Inverse Head & Shoulders breakout above $172.03. Combined with the company's dominant market position, high-margin digital business model and favourable long-term exposure to Australia's residential property market, the breakout suggests the medium-term downtrend has transitioned into a renewed uptrend.
As long as REA remains above the former neckline near $172.03, the bullish outlook remains intact. The confirmed pattern initially targets $180.95, while a sustained move above this resistance would open the way towards the full measured objective near $207.73, making the breakout level the key technical support for investors to monitor.


 Nov 12, 2026





 Please wait processing your request...