
 CA
 NZ
 UK
 US
 IND

 AU

 Share
 X (Formerly Twitter)
 Whatsapp
 Facebook
 LinkedIn
 Telegram
 Email This Article
 Copy Link
 Summarize with AI
 Chat GPT
 Perplexity

Key Highlights
- Ramelius Resources may be facing a moderation in upward momentum as institutional Capital evaluates gold producer valuation multiples following a sustained primary cyclical advance.
- The technical price action is flashing potential warning signs, characterized by a sharp 6.41% recent decline that is currently compressing against a critical confluence of structural support.
- The stock is developing what appears to be a large-scale Head &Amp; Shoulders distribution pattern, featuring a localized Double Top at its peak, with critical downside risk pivoting near the $3.27 level.
While Ramelius Resources Limited (ASX:RMS) spent previous cycles enjoying a robust primary uptrend, the technical landscape has recently shown signs of a definitive structural shift. As the broader market evaluates the valuation multiples of gold producers following a prolonged advance, RMS appears to be undergoing a phase of institutional distribution. The recent softening in price action, highlighted by a sharp 6.41% daily decline to $3.36, suggests that the long-term mark-up phase might be exhausting, which could potentially pave the way for a new cyclical downtrend.
Production Profile and Margin Dynamics
RMS’s fundamental Investment thesis is heavily anchored to the consistent output and operational efficiency of its Western Australian gold Assets:
- Profit Taking and Valuation: Following a multi-month rally that pushed the stock to peak historical valuation levels, institutional Capital might be actively taking profits. As upward momentum moderates and exhaustion patterns materialize on the chart, the market may be transitioning from a phase of accumulation into a sustained distribution cycle.
- Production Profile: RMS relies heavily on the consistent output from its key gold operations. The market continuously assesses the operational efficiency and life-of-mine extensions at these core Assets to justify the current market Capitalization.
- Margin Dynamics: The company remains inherently sensitive to the All-In Sustaining Costs (AISC) of gold production. As labor and material costs remain elevated, any stabilization or dip in spot gold prices could compress free Cash Flow yields and heavily impact the stock's Valuation Premium.
Associated Risks
A primary risk for Ramelius Resources remains its inherent Leverage to the underlying spot gold price. If macroeconomic conditions shift, such as a strengthening US Dollar or rising real yields, any resulting weakness in global bullion prices could potentially compress the company's operating margins. A reduction in free Cash Flow could justify a lower valuation multiple, exacerbating the technical distribution currently visible on the chart. Furthermore, any unexpected operational disruptions or lower-than-expected grade reconciliations at its primary processing hubs would severely compress the project's net present value (NPV).
Technical Outlook
The Daily Chart for Ramelius Resources provides a textbook example of structural exhaustion and potential breakdown mechanics, highlighting a transition from a primary uptrend into a localized distribution phase.
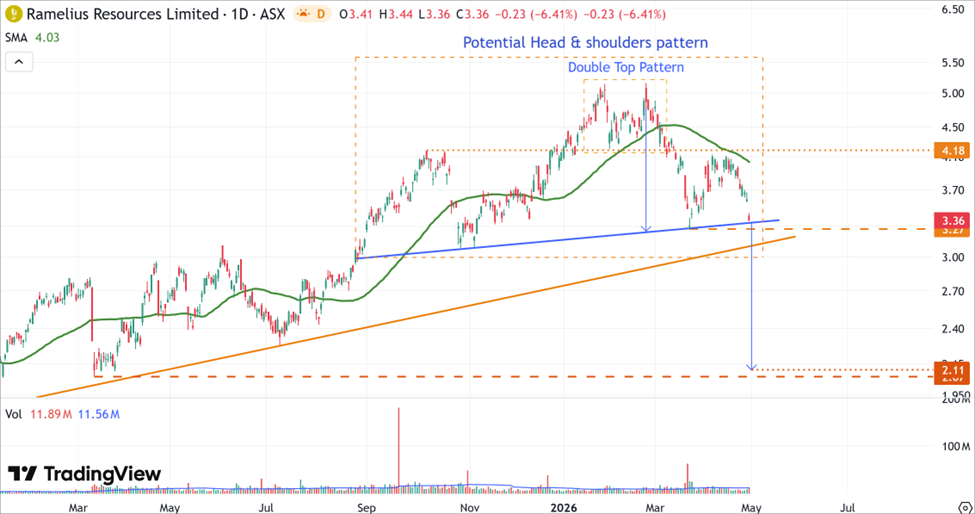
RMS’s Daily Price Chart (at the closing price of 30th April 2026). Powered by: tradingview.com
- On the Daily Chart, RMS’s stock price completed a localized Double Top pattern at its peak, which forms the head of a much larger, potential Head &Amp; Shoulders distribution pattern, indicating a negative bias.
- With the price action actively pressuring the critical support confluence near the $3.27 pivot level, a structural breakdown and daily close below this zone could be a bearish signal. If fractured, it might open the door to the pattern’s full measured move target at $2.11, which aligns to a significant support established by the March 2025 trough.
Ramelius Resources (ASX:RMS) presents a challenging alignment of fundamental valuation pressures and short-term technical vulnerability. The stock has carved out a localized Double Top within a broader Head &Amp; Shoulders distribution pattern, and price action is now heavily pressuring a critical dual-support floor near $3.27. Investors and active traders might want to exercise caution and closely monitor this horizontal and dynamic support confluence. A confirmed structural breakdown below $3.27 could validate the distribution cycle and might heavily favor a continued, dynamic descent toward the $2.11 measured move objective.


 Nov 12, 2026





 Please wait processing your request...