
 CA
 NZ
 UK
 US
 IND

 AU

 Share
 X (Formerly Twitter)
 Whatsapp
 Facebook
 LinkedIn
 Telegram
 Email This Article
 Copy Link
 Summarize with AI
 Chat GPT
 Perplexity

Highlights
- Ramelius Resources reports 36% YoY revenue growth, and 119% YoY NPAT increase in FY25.
- Gold production reaches 302,882 ounces with lower costs and improved ore grades.
- Mineral resources rise 38% and ore reserves increase 118% after Spartan acquisition.
Ramelius Resources Limited (ASX:RMS) is a gold producing company based in Western Australia, operating since 2006. The company manages several key assets, including the Edna May, Marda, Mt Magnet, Penny, Symes, and Tampia gold mines. The company focuses on expanding its operations through exploration and development activities across its portfolio of gold projects in Western Australia.
Financial Update
For the year ended 30 June 2025 (FY25), RMS has reported sales revenue of AUD 1,203.4 million, up 36% YoY from AUD 882.6 million in FY24. EBIT rose to AUD 654.6 million in FY25, up 143% from 269.0 million in FY24 and NPAT increased to AUD 474.2 million (up 119%) in FY25 from AUD 216 million in FY24. The results were supported by gold production of 302,882 ounces, a 32% higher realised gold price, improved ore grades at Cue and Penny, and a lower all-in sustaining cost (AISC). Operating cash flow for the year was AUD 856.4 million.
Business Update
The company reported free cash flow of AUD 129 million and total cash & gold holdings of AUD 827.7 million for the September 2025 quarter. In the same period gold production was 55,013 ounces at an AISC of AUD 1,836/oz. The company completed the Spartan Resources acquisition, spent AUD 18.8 million on exploration, and recorded a 38% rise in mineral resources to 12Moz and 118% growth in ore reserves to 2.4Moz.
Key positives and Negatives
The company’s EBITDA margin rose to 68.5% in FY25, up from 52.0% in FY24, in the same period its net margin increased to 39.4% compared to 24.5% in the previous year. However, the asset turnover ratio declined slightly to 0.60x in FY25 from 0.64x in FY24, and ore tonnes mined dropped significantly, down 63% YoY in FY25.
Business Outlook
The integration of Dalgaranga with Mt Magnet is expected to enhance ore sequencing and processing, targeting annual production of around 500,000 ounces by FY30.
The company also plans to expand plant capacity and improve operational efficiency to lower per-ounce costs. Continued exploration at high-grade and regional deposits aims to extend mine life, improve long-term production sustainability and increase reserves.
Share Performance of RMS
RMS’ shares were trading at AUD 3.30 per share on 27 October 2025 with intraday loss of 5.71%. RMS’ stock up by 26.92% over the past three months, 32.53% over the past six months, and 36.36% over the past year. RMS’s 52 week high is AUD 4.18, recorded on 07 October 2025 and 52 week low is AUD 1.93, recorded on 14 November 2025.
Support and Resistance Summary
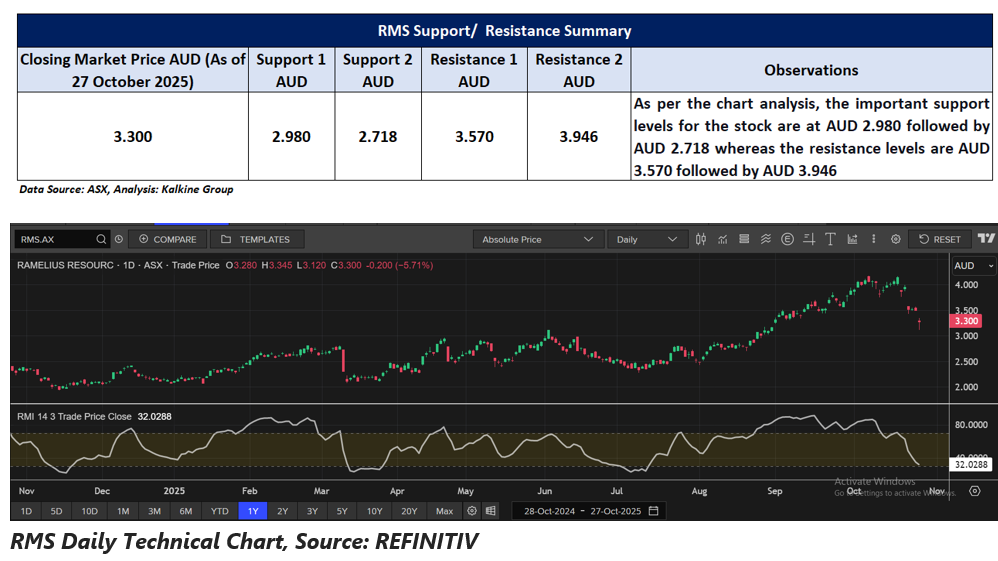
Note 1: Past performance is neither an Indicator nor a guarantee of future performance.
Note 2: The reference date for all price data, and currency, is 27 October 2025. The reference data in this report has been partly sourced from EODHD/Others.
Technical Indicators Defined:
Support: A level at which the stock prices tend to find support if they are falling, and a downtrend may take a pause backed by demand or buying interest. Support 1 refers to the nearby support level for the stock and if the price breaches the level, then Support 2 may act as the crucial support level for the stock.
Resistance: A level at which the stock prices tend to find resistance when they are rising, and an uptrend may take a pause due to profit booking or selling interest. Resistance 1 refers to the nearby resistance level for the stock and if the price surpasses the level, then Resistance 2 may act as the crucial resistance level for the stock.


 Nov 12, 2026





 Please wait processing your request...