
 CA
 NZ
 UK
 US
 IND

 AU

 Share
 X (Formerly Twitter)
 Whatsapp
 Facebook
 LinkedIn
 Telegram
 Email This Article
 Copy Link
 Summarize with AI
 Chat GPT
 Perplexity

Image source: Shutterstock
Highlights
- RMS’ revenue increased by 45.77% YoY to AUD 508 million and net profit after tax jumps 313.59% YoY to AUD 170.4 million in H1 FY25.
- In H1 FY25, cash and gold holdings rise to AUD 501.7 million and total liquidity reaches AUD 1.0 billion.
- FY25 production guidance increased to 290,000–300,000 ounces.
Ramelius Resources Ltd (ASX:RMS) is a leading Western Australian gold producer and has reported encouraging numbers in the first half of fiscal year 2025 (H1 FY25). The company’s results were driven by high-grade ore production, operational efficiency, and elevated gold prices. Furthermore, on the back of its recent performance, the company has upgraded it FY25 guidance.
Financial performance in H1 FY25
Revenue for H1 FY25 surged 45.77% YoY to AUD 508 million, while EBITDA more than doubled, rising 119.4% YoY to AUD 307.6 million. Net profit after tax soared by 313.59% YoY to AUD 170.4 million in H1 FY25. The financials were largely attributed to a 19% YoY increase in gold production, totalling 147,775 ounces, and a 26% YoY rise in realised gold prices, reaching AUD 3,541/oz.
Cost efficiency remained a key driver, with the All-in Sustaining Cost (AISC) dropping 11% YoY to AUD 1,699/oz, supported by lower-cost operations at the Mt Magnet hub. These operational gains contributed to a substantial increase in free cash flow, reaching AUD 264.1 million, and bolstered the company's cash and gold holdings to AUD 501.7 million. Liquidity stood strong at AUD 1.0 billion, which includes undrawn debt facilities and listed investments.
The company’s balance sheet now boasts net assets of AUD 1.52 billion, more than doubling since H1 FY23.
March 2025 Quarterly Update
In its March 2025 Quarterly Activities Report, Ramelius revealed that Q3 FY25 gold production reached 80,455 ounces at an AISC of AUD 1,492/oz. The Mt Magnet hub contributed a significant 67,464 ounces at a lower AISC of AUD 1,226/oz. For the quarter alone, underlying free cash flow stood at AUD 223 million, bringing the year-to-date total to AUD 487 million, while pushing cash and gold holdings to AUD 657.1 million.
Outlook
The company has revised its full-year FY25 gold production guidance to between 290,000 and 300,000 ounces, up from its previous 270,000–300,000 range. AISC guidance was also narrowed to AUD 1,550–1,650/oz. Capital expenditure for Q3 was AUD 7.5 million, largely directed toward Cue open-pit operations, with full-year expectations ranging between AUD 20–30 million.
Ramelius is actively pursuing a strategy of transitioning to a lower-cost, higher-margin production base, centred around its Mt Magnet hub. Its Rebecca-Roe project is advancing toward a final investment decision, expected by September 2025. Additionally, the company is integrating Spartan Resources as part of a broader plan to scale up to 500,000 ounces of gold production annually by FY30.
Share performance of RMS
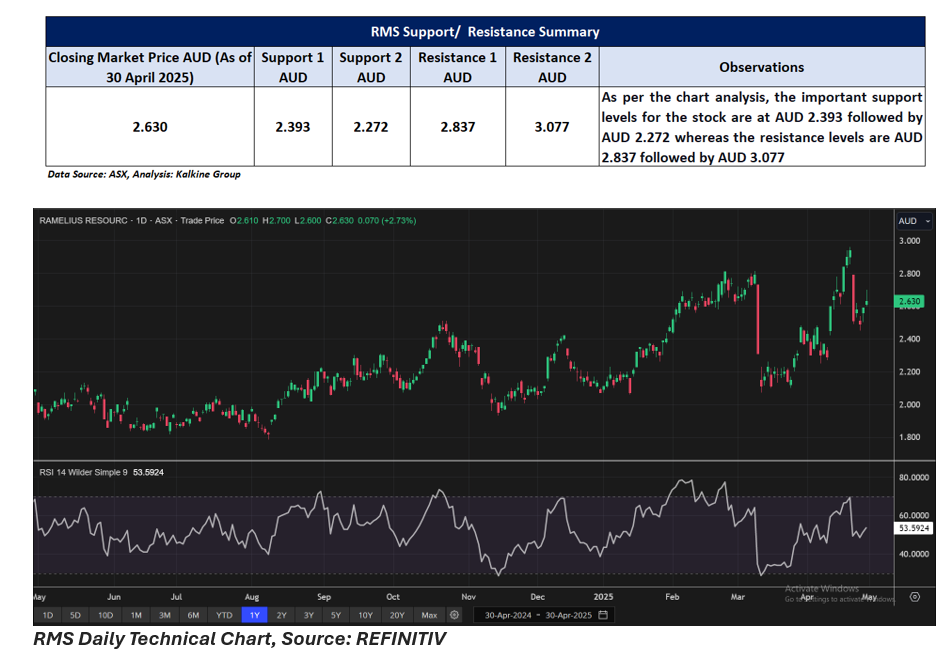
RMS shares closed 2.73% higher at AUD 2.63 per share on 30 April 2025. Over the past year, RMS’ share price has increased by approximately 25.84% and in the last three months, it has gained 10.04%.
52-week high of RMS is AUD 2.96, recorded on 22 April 2025 and 52-week low is AUD 1.785, recorded on 8 August 2024.
Support and Resistance Summary
Note 1: Past performance is neither an Indicator nor a guarantee of future performance.
Note 2: The reference date for all price data, and currency, is 30 April 2025. The reference data in this report has been partly sourced from EODHD/Others.
Technical Indicators Defined:
Support: A level at which the stock prices tend to find support if they are falling, and a downtrend may take a pause backed by demand or buying interest. Support 1 refers to the nearby support level for the stock and if the price breaches the level, then Support 2 may act as the crucial support level for the stock.
Resistance: A level at which the stock prices tend to find resistance when they are rising, and an uptrend may take a pause due to profit booking or selling interest. Resistance 1 refers to the nearby resistance level for the stock and if the price surpasses the level, then Resistance 2 may act as the crucial resistance level for the stock.


 Nov 12, 2026





 Please wait processing your request...