
 CA
 NZ
 UK
 US
 IND

 AU

 Share
 X (Formerly Twitter)
 Whatsapp
 Facebook
 LinkedIn
 Telegram
 Email This Article
 Copy Link
 Summarize with AI
 Chat GPT
 Perplexity

Highlights
- Pinnacle’s FY25 revenue rose 34% year-on-year, supported by record inflows and affiliate growth.
- Total affiliate FUM increased 10% in Q1 FY26, reaching AUD 197.4 billion.
- The company plans to acquire up to 13% of Japan-based Advantage Partners for AUD 92 million.
Pinnacle Investment Management Group Limited (ASX:PNI) is an Australian multi-affiliate investment management firm. It holds equity stakes in its affiliates and provides seed funding, global distribution, and business support services, including middle-office and infrastructure solutions. Its affiliates offer diverse investment products across asset classes, including managed funds, active ETFs, listed investment vehicles, and collective investment trusts.
Financial Performance
For the financial year 2025 (FY25), the company reported revenue of AUD 65.5 million, up 34% YoY from FY24, driven by higher affiliate profits, record inflows of AUD 23.1 billion, and global FUM reaching AUD 179.4 billion. Performance fees contributed AUD 46.6 million, with 82% YoY of eligible FUM at or near its high watermark.
The company’s share of affiliates’ NPAT rose 43% YoY to AUD 129.7 million in FY25 compared to AUD 90.8 million in FY24, Meanwhile NPAT attributable to shareholders increased 40% YoY to AUD 117.0 million in FY25 compared to 83.3 million in in FY24.
Business Updates
On 11 November 2025, PNI’s Director Christa Lenard increased her indirect shareholding by 968 shares to 3,418 through the exercise of performance rights granted in lieu of director fees, with no payment made.
On 31 October 2025, the company reported a 10% quarter-on-quarter (QoQ) rise in total affiliate FUM to AUD 197.4 billion, driven by AUD 13.3 billion in net inflows. Retail FUM grew 12% to AUD 44.4 billion, and international FUM rose 8% to AUD 55.7 billion.
On 22 October 2025, the company announced plans to acquire up to 13% of Japan-based Advantage Partners for AUD 92 million, expanding its exposure to private markets and Japan’s institutional sector.
Key Positives and Negatives
In FY25, the company reported a 60% increase in net profit before tax, while operating expenses increased by 3% YoY compared to FY24. The company’s return on equity declined to 19.6% in FY25 from 20.6% in the previous year.
Business Outlook
PNI’s growth strategy is structured around three key horizons. Horizon 1 focuses on driving inflows into existing investment strategies, Horizon 2 targets platform expansion through high-return initiatives, and Horizon 3 emphasises strategic acquisitions such as Advantage Partners, strengthening its position in global private markets.
The company aims to maintain sustainable growth by combining organic inflows, platform diversification, and selective acquisitions. With capital flexibility and an expanding international presence, Pinnacle seeks to enhance its long-term revenue base and performance fee potential.
Share Performance of PNI
PNI’s shares were trading at AUD 17.55 per share on 13 November 2025 with an intraday gain of 0.06%. PNI’s stock has declined by 22.82% in the last three months, 11.89% down over the six months, and decline by 16.66% over the past year. PNI’s 52-week high is AUD 27.11, recorded on 05 February 2025 and 52-week low is AUD 13.59, recorded on 07 April 2025.
Support and Resistance Summary
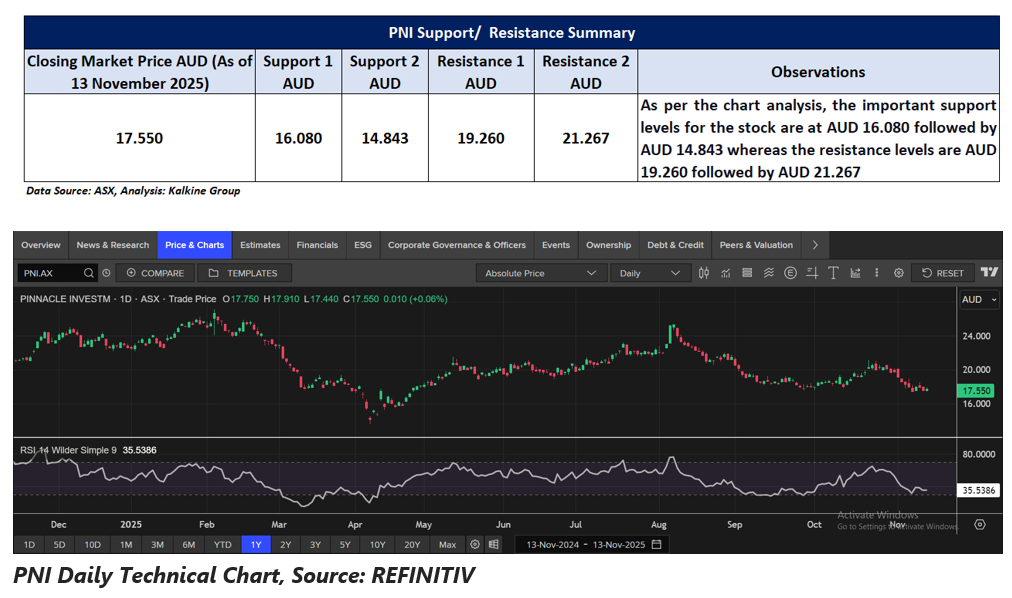
Note 1: Past performance is neither an Indicator nor a guarantee of future performance.
Note 2: The reference date for all price data, and currency, is 13 November 2025. The reference data in this report has been partly sourced from EODHD/Others.
Technical Indicators Defined:
Support: A level at which the stock prices tend to find support if they are falling, and a downtrend may take a pause backed by demand or buying interest. Support 1 refers to the nearby support level for the stock and if the price breaches the level, then Support 2 may act as the crucial support level for the stock.
Resistance: A level at which the stock prices tend to find resistance when they are rising, and an uptrend may take a pause due to profit booking or selling interest. Resistance 1 refers to the nearby resistance level for the stock and if the price surpasses the level, then Resistance 2 may act as the crucial resistance level for the stock.


 Nov 12, 2026





 Please wait processing your request...