
 CA
 NZ
 UK
 US
 IND

 AU

 Share
 X (Formerly Twitter)
 Whatsapp
 Facebook
 LinkedIn
 Telegram
 Email This Article
 Copy Link
 Summarize with AI
 Chat GPT
 Perplexity
Image source: Shutterstock
Highlights
- PLS’s H1FY25 revenue declined by 44% YoY due to a 58% fall in average prices.
- The company’s underlying EBITDA fell by 83% YoY to AUD 74.0 million during the period.
- PLS targets AUD 578/t unit cost by FY26 through cost reduction, efficiency, and renewable integration.
Pilbara Minerals Limited (ASX:PLS) is an ASX-listed lithium mining company focused on the exploration, development, and operation of lithium and other mineral resources.
In the first half of the financial year 2025 (H1FY25), the company’s sales volume increased by 27.51% YoY to 408.3 kt. Despite this, revenue declined by 44% YoY to AUD 426.0 million, as average prices fell by 58% annually, resulting in a net loss of AUD 69 million in H1FY25 versus a net profit of AUD 220 million in H1FY24. During the reported period, underlying EBITDA fell by 83% YoY to AUD 74.0 million, down from AUD 431.1 million in H1FY24.
During the March quarter of FY25, the company recorded AUD 150 million in revenue, representing a 30% decline compared to the December 2024 quarter. The drop was primarily driven by a 39% fall in sales volumes due to a decrease in production, although this was partially offset by a 7% rise in average realised prices.
Recent Business Update
Through an ASX update dated 11 June 2025, the company announced a 10% increase in total mineral resources tonnage and a 23% rise in contained lithium oxide at its Pilgangoora operation, 100% owned by PLS. Now, the updated resource includes 5.7 million tonnes of lithium oxide at 1.28% Li2O.
Company Outlook
PLS reaffirmed its full-year production guidance of 700,000–740,000 tonnes of spodumene concentrate, with expected operating costs of AUD 620–640 per tonne FOB, supported by improved processing efficiency and scale benefits from Pilgan Plant expansion and cost reduction initiatives.
The company is focusing on cost optimisation, operational efficiencies, and renewable energy integration to control costs, aiming to achieve a unit cost of around AUD 578/t by FY26.
Share performance of PLS
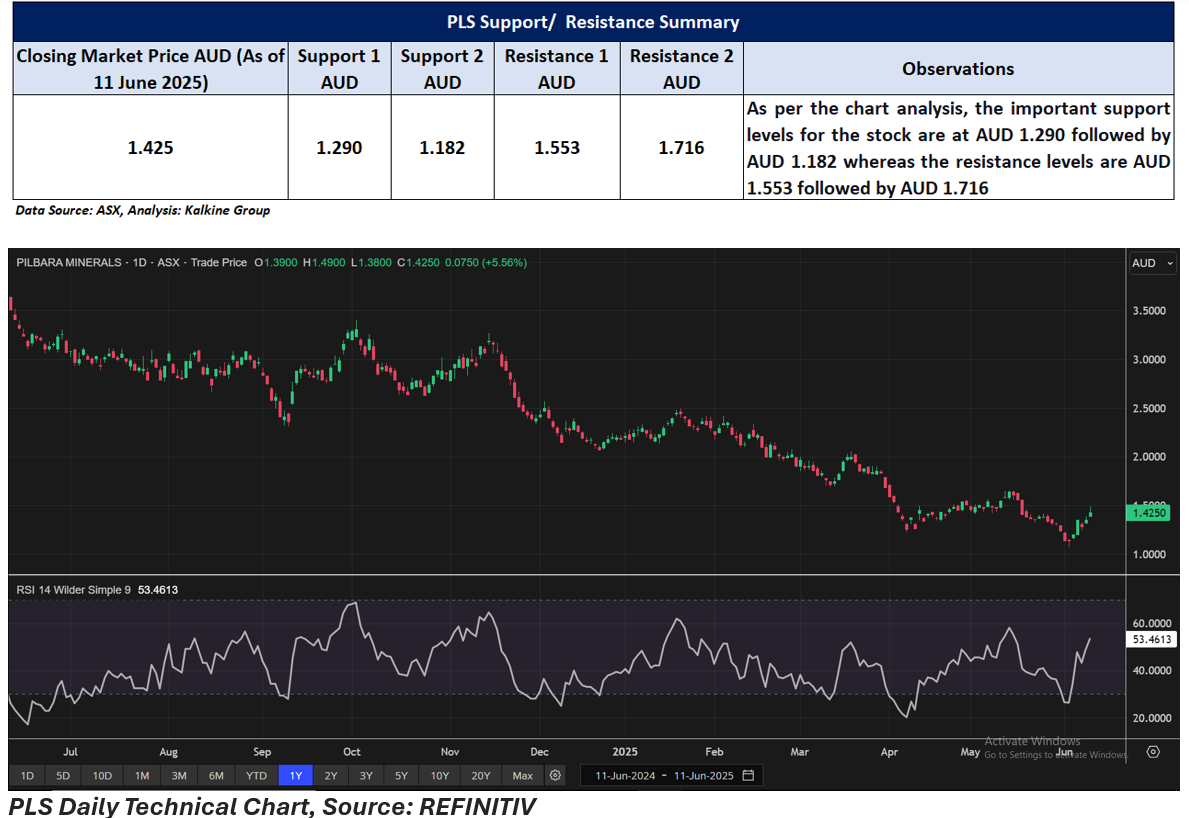
PLS shares rose 5.56% to close at AUD 1.425 on 11 June 2025. Despite this intraday gain and a weekly return of 18.75%, the stock has experienced a significant decline of 34.93% year-to-date and 59.40% over the past year. One-month and three-month losses stand at 7.77% and 16.91%, respectively.
PLS recorded its 52-week high of AUD 3.64 on 11 June 2024 and a 52-week low of AUD 1.07 on 3 June 2025.
Support and Resistance Summary
Note 1: Past performance is neither an Indicator nor a guarantee of future performance.
Note 2: The reference date for all price data, and currency, is 11 June 2025. The reference data in this report has been partly sourced from EODHD/Others.
Technical Indicators Defined:
Support: A level at which the stock prices tend to find support if they are falling, and a downtrend may take a pause backed by demand or buying interest. Support 1 refers to the nearby support level for the stock and if the price breaches the level, then Support 2 may act as the crucial support level for the stock.
Resistance: A level at which the stock prices tend to find resistance when they are rising, and an uptrend may take a pause due to profit booking or selling interest. Resistance 1 refers to the nearby resistance level for the stock and if the price surpasses the level, then Resistance 2 may act as the crucial resistance level for the stock.


 Nov 12, 2026





 Please wait processing your request...