
 CA
 NZ
 UK
 US
 IND

 AU

 Share
 X (Formerly Twitter)
 Whatsapp
 Facebook
 LinkedIn
 Telegram
 Email This Article
 Copy Link
 Summarize with AI
 Chat GPT
 Perplexity

Highlights
- Nuix Neo’s ACV grew 132% YOY in FY25, with customer numbers reaching seventy-five.
- The company has reported FY25 revenue of AUD 221.5 million, driven by higher support sales.
- NXL has posted 24.5% YoY increase in cash EBITDA, despite underlying cash flow declining 18.6% in FY25.
Nuix Limited (ASX:NXL) provides investigative analytics and intelligence software for collecting, processing, and reviewing large volumes of structured and unstructured data. The company delivers scalable and accurate insights to support decision-making.
Financial Performance
NXL has reported total revenue of AUD 221.5 million for the financial year 2025 (FY25), a 0.4% increase from AUD 220.6 million in FY24, mainly due to fewer multi-year contracts. Meanwhile, other revenue increased on Advantage (support) sales. Sales and distribution expenses fell during the reported period due to higher headcount and marketing costs were offset by lower variable pay amid slower ACV (annualised contract value) growth.
Research and development expenses rose because of headcount reallocation and a higher expensed portion related to customer improvements and new product development. Nuix Neo ACV grew 132% YoY, with customer numbers increasing to 75 in FY25 from 23 in FY24. Underlying EBITDA in FY25 declined 6.8% YoY to AUD 60.0 million in FY25 from AUD 64.4 million in the previous year.
Business Update
On 8 October 2025, NXL announced that UBS Group AG and its related entities ceased to be substantial holders in the company, effective 6 October 2025.
Key Positives and Negatives
In FY25, NXL recorded an 8% YoY increase in Annualised Contract Value (ACV) and cash EBITDA rose 24.5% YoY. However, underlying cash flow declined 18.6% YoY in FY25, and statutory EBITDA fell 14.8% over the same period.
Business Outlook
For FY26, Nuix plans to continue its business transformation by focusing on higher-value customer contracts and expanding its capabilities. The company anticipates ACV growth to be led by Nuix Neo, with revenue expected to rise faster than operating costs, and underlying cash flow to stay positive throughout the year.
Share performance of NXL
As of 15 October 2025, NXL traded at AUD 2.970, down 1.33% in intraday trading. The stock has risen 30.83% over the past three months and 24.78% over the past six months but remains down 44.79% over the past year. NXL’s 52-week high is AUD 7.857, recorded on 11 November 2024, while its 52-week low is AUD 1.785, recorded on 7 May 2025.
Support and Resistance Summary
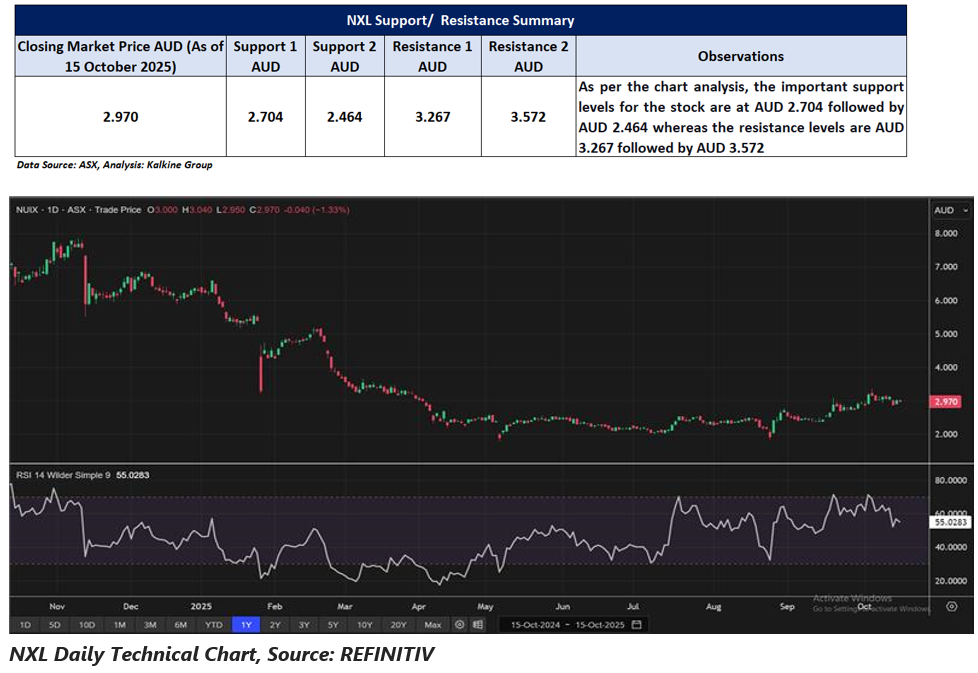
Note 1: Past performance is neither an Indicator nor a guarantee of future performance.
Note 2: The reference date for all price data, and currency, is 15 October 2025. The reference data in this report has been partly sourced from EODHD/Others.
Technical Indicators Defined:
Support: A level at which the stock prices tend to find support if they are falling, and a downtrend may take a pause backed by demand or buying interest. Support 1 refers to the nearby support level for the stock and if the price breaches the level, then Support 2 may act as the crucial support level for the stock.
Resistance: A level at which the stock prices tend to find resistance when they are rising, and an uptrend may take a pause due to profit booking or selling interest. Resistance 1 refers to the nearby resistance level for the stock and if the price surpasses the level, then Resistance 2 may act as the crucial resistance level for the stock.


 Nov 12, 2026





 Please wait processing your request...