
 CA
 NZ
 UK
 US
 IND

 AU

 Share
 X (Formerly Twitter)
 Whatsapp
 Facebook
 LinkedIn
 Telegram
 Email This Article
 Copy Link
 Summarize with AI
 Chat GPT
 Perplexity

Image source: Shutterstock
Highlights
- Net revenue of NXT increased 12.5% YoY to AUD 167.8 million in H1 FY 2025; underlying EBITDA climbs 3.3% YoY to AUD 105.4 million.
- Gross profit of NXT grows to AUD 175.5 million with stable 75.2% margin; debt-to-equity ratio falls to 0.20×.
- FY 2025 guidance set at AUD 340–350 million revenue, AUD 210–220 million EBITDA, and AUD 1.3–1.5 billion capex.
NEXTDC Limited (ASX:NXT) is an ASX-listed Data Centre-as-a-Service provider delivering critical power, security and connectivity solutions to global cloud platforms, enterprises, and government clients across Australia.
H1 FY25 Operating Performance
For the six months ended 31 December 2024, NEXTDC reported net revenue of AUD 167.77 million, up 12.5% YoY from AUD 149.10 million in the prior comparable period. This growth was driven by higher sales of white-space rack-ready services, power-recharge offerings, establishment fees and ancillary add-ons.
Underlying EBITDA for the period rose 3.3% YoY to AUD 105.37 million, reflecting an additional AUD 3.4 million of profit supported by top-line expansion.
Profitability and Cost Management
- Gross Profit climbed from AUD 152.4 million in H1 FY24 to AUD 175.5 million in H1 FY25, fuelled by lower direct costs.
- Gross Profit Margin held steady at 75.2%, up from 67.8% a year earlier and flat with the second half of FY 2024.
- EBITDA Margin improved to 55.3%, compared to 53.8% in H2 FY24.
Business Update
On 15 April 2025, the board granted 3,633,720 performance rights to director Craig Ian Scroggie under the company’s Growth Incentive Plan.
Outlook and Guidance
NEXTDC has reaffirmed its FY 2025 targets:
- Net Revenue: AUD 340–350 million
- Underlying EBITDA: AUD 210–220 million
- Capital Expenditure: AUD 1.3–1.5 billion
Recent Share Performance
NXT shares closed at AUD 11.12 per share on 24 April 2025 with a market cap of AUD 7.05 billion. NXT’s share price has declined ~30.8% over the past three months and ~31.4% over six months, trading below its 52-week high-low midpoint. The stock’s 52-week low and high stand at AUD 9.40 and AUD 18.58, respectively.
Support and Resistance Summary
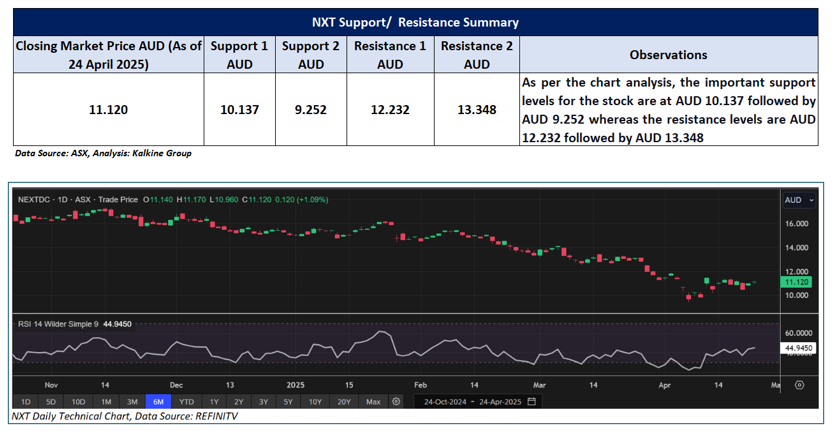
Note 1: Past performance is neither an Indicator nor a guarantee of future performance.
Note 2: The reference date for all price data, and currency, is 24 April 2025. The reference data in this report has been partly sourced from EODHD/Others.
Technical Indicators Defined:
Support: A level at which the stock prices tend to find support if they are falling, and a downtrend may take a pause backed by demand or buying interest. Support 1 refers to the nearby support level for the stock and if the price breaches the level, then Support 2 may act as the crucial support level for the stock.
Resistance: A level at which the stock prices tend to find resistance when they are rising, and an uptrend may take a pause due to profit booking or selling interest. Resistance 1 refers to the nearby resistance level for the stock and if the price surpasses the level, then Resistance 2 may act as the crucial resistance level for the stock.


 Nov 12, 2026





 Please wait processing your request...