
 CA
 NZ
 UK
 US
 IND

 AU

 Share
 X (Formerly Twitter)
 Whatsapp
 Facebook
 LinkedIn
 Telegram
 Email This Article
 Copy Link
 Summarize with AI
 Chat GPT
 Perplexity

Highlights:
- NEM’s FY25 sales increased by 21% YoY to USD 22,669 million.
- Net income rose 112% YoY to USD 7,085 million in FY25.
- Operating cash flow grew 64% YoY to USD 10,334 million.
Newmont Corporation (ASX:NEM), a leading gold producer with diversified metal assets including copper, zinc, lead, and silver, reporting encouraging financial and operational results for the full fiscal year ended 31 December 2025 (FY25). Supported by assets spread across favourable mining jurisdictions worldwide, Newmont reported notable growth in revenue, earnings, and cash flow driven by higher gold prices and stable production. The company has also provided an outlook for FY26, focusing on planned production sequencing, capital investments, and cost management strategies.
FY25 Financial Results Highlight Substantial Gains
Newmont’s FY25 sales surged to USD 22,669 million, marking a 21% increase compared to USD 18,682 million in FY24. Net income more than doubled to USD 7,085 million, representing a 112% year-over-year increase. Operating cash flow also expanded by 64%, reaching USD 10,334 million in FY25, up from USD 6,318 million the previous year.
This performance was primarily supported by significantly higher realised gold prices averaging over USD 4,000 per ounce and steady production of 5.9 million gold ounces. The company’s disciplined cost controls, by-product credits, and portfolio optimization contributed to improving margins and free cash generation.
Mineral Reserves Update: Adjustments Reflect Strategic Changes
On 19 February 2026, Newmont provided an update on its mineral reserves for FY25. The company reported gold mineral reserves of 118.2 million ounces, down from 134.1 million ounces in FY24. The decline was mainly attributed to asset divestments, mining depletion, and reserve reclassifications at certain operations, including Yanacocha Sulfides.
However, this decrease was partially balanced by higher gold price assumptions and resource conversions at key projects such as Brucejack and Lihir. Additionally, Newmont reported 12.5 million tonnes of copper reserves and significant silver resources, maintaining its position with the largest gold reserve base in the industry. The company anticipates over 10 years of reserve life across multiple sites.
FY26 Outlook
Looking ahead to FY26, Newmont expects attributable gold production to be approximately 5.3 million ounces. This projection factors in sequencing transitions at key mines such as Peñasquito, Cadia, and Ahafo South, partially offset by increased production from Ahafo North. In the longer term, the company targets production growth towards 6 million ounces annually, supported by higher-grade operations at Boddington and the Tanami Expansion 2 project.
The anticipated all-in sustaining cost (AISC) guidance for FY26 is USD 1,680 per ounce, reflecting lower volumes, deferred sustaining capital, and increased royalty assumptions. Sustaining capital expenditure is planned at USD 1.95 billion, with development capital set at USD 1.4 billion, focusing on tailings integrity and key expansion projects to ensure asset longevity.
Share Performance of NEM
NEM shares rose by 5.65% to close at AUD 187.220 per share on 2 March 2026. Over the past year, the NEM’s share price has surged 180.14%. It has gained 8.04% over the past month, 62.32% over six months, and 6.47% over the past week. Additionally, Newmont experienced growth of 34.45% in the last three months and 129.38% over nine months. The 52-week high for Newmont is AUD 190.540, reached on 29 January 2026, while the 52-week low is AUD 66.390, recorded on 11 March 2025.
Support and Resistance Summary
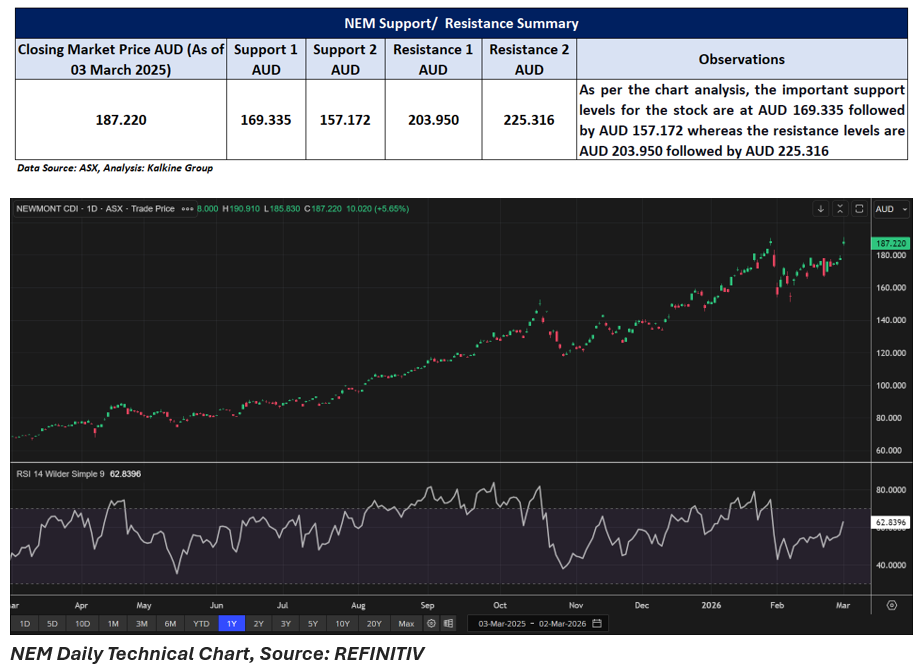
Note 1: Past performance is neither an Indicator nor a guarantee of future performance.
Note 2: The reference date for all price data, and currency, is 02 March 2026. The reference data in this report has been partly sourced from EODHD/Others.
Technical Indicators Defined:
Support: A level at which the stock prices tend to find support if they are falling, and a downtrend may take a pause backed by demand or buying interest. Support 1 refers to the nearby support level for the stock and if the price breaches the level, then Support 2 may act as the crucial support level for the stock.
Resistance: A level at which the stock prices tend to find resistance when they are rising, and an uptrend may take a pause due to profit booking or selling interest. Resistance 1 refers to the nearby resistance level for the stock and if the price surpasses the level, then Resistance 2 may act as the crucial resistance level for the stock.


 Nov 12, 2026





 Please wait processing your request...