
 CA
 NZ
 UK
 US
 IND

 AU

 Share
 X (Formerly Twitter)
 Whatsapp
 Facebook
 LinkedIn
 Telegram
 Email This Article
 Copy Link
 Summarize with AI
 Chat GPT
 Perplexity

Key Highlights
- Newmont remains the world’s leading gold producer, boasting a world-class portfolio of long-life, low-cost assets across tier-one jurisdictions.
- The company’s focus on disciplined capital allocation and shareholder returns remains a cornerstone of its "blue-chip" status in the materials sector.
- Synergies from recent large-scale acquisitions continue to optimize the group's global production profile and AISC positioning.
While Newmont Corporation (ASX:NEM) continues to hold the mantle of global leadership in precious metals, the stock is currently grappling with a significant technical breakdown. As the "RBA Tightrope" and shifting US Treasury yields influence gold-equity valuations, NEM’s price action has definitively severed its previous bullish structure, suggesting that a period of downward repricing is currently underway.
Scale, Synergies, and Sector Sensitivity
NEM’s fundamental narrative is defined by its unparalleled operational scale and its role as a primary proxy for global gold sentiment:
- Production Integration: The ongoing integration of high-margin assets has allowed Newmont to streamline its operating expense profile, providing a critical buffer for its EBITDA margins even as input costs remain elevated.
- Capital Discipline: Management’s commitment to a robust balance sheet and a sustainable dividend policy ensures that NEM remains a preferred destination for institutional liquidity within the mining space.
- Macro Exposure: As a major blue-chip vehicle, Newmont is highly sensitive to the global interest rate environment, which has recently introduced a layer of valuation pressure across the gold sector.
Associated Risks
The primary risk for Newmont remains a sustained retreat in spot gold prices and potential geopolitical shifts affecting its international mining jurisdictions. Furthermore, any delays in realizing merger-related cost savings could impact the stock's projected earnings per share in the near term.
Technical Outlook
The technical picture for Newmont Corporation (ASX:NEM) has deteriorated significantly since the completion of the Double Top pattern highlighted in the previous analysis. While the initial bearish target projected from the Double Top has largely been achieved, the latest price action reveals the completion of a much larger and more significant Head and Shoulders reversal pattern, suggesting the broader correction may still have further to run. The updated chart indicates that bearish momentum has evolved from a short-term trend reversal into a major structural breakdown.
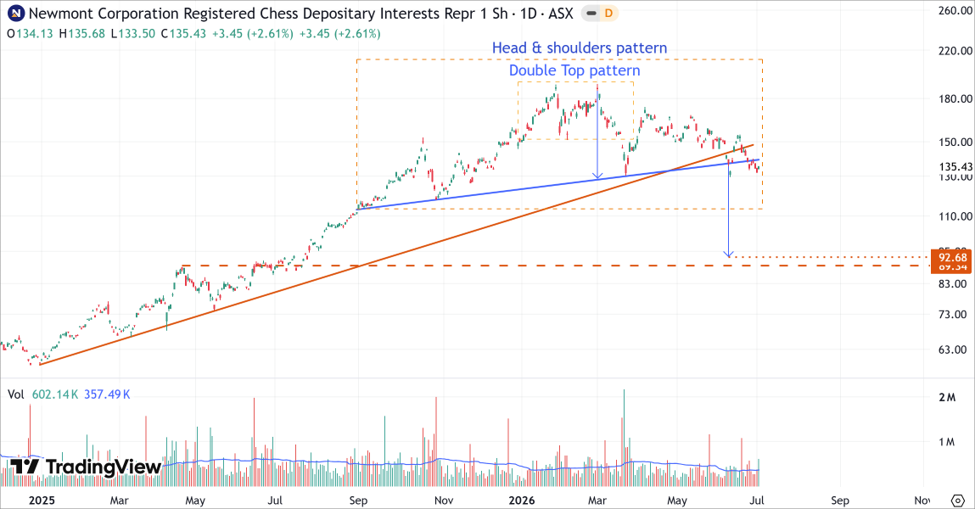
NEM’s Daily Price Chart (at the closing price of 02/07/2026). Powered by: tradingview.com
- Following the breakdown of the upward trendline in March 2026, NEM continued to weaken and eventually completed the previously identified Double Top pattern. The stock subsequently declined toward the projected downside objective, validating the bearish signal.
- More importantly, the entire price structure that developed between September 2025 and June 2026 has now formed a large Head and Shoulders pattern.
- The neckline of this larger Head and Shoulders pattern was supported by an ascending trendline connecting the September 2025 and November 2025 lows. Recent price action has decisively broken below this neckline, confirming the completion of the bearish reversal structure.
- Based on the measured-move methodology, the Head and Shoulders pattern generates a downside target near $92.68, aligning closely with a major support region established during mid-2025, increasing its technical significance as a potential destination for the current correction.
Bottom Line
Newmont Corporation (ASX:NEM) remains one of the world's highest-quality gold producers, supported by its globally diversified asset base, strong balance sheet, and industry-leading scale. However, the technical outlook has weakened materially since the completion of the Double Top pattern identified in March. The stock has now confirmed a much larger Head and Shoulders reversal pattern, accompanied by a break of the long-standing rising trendline, signalling a potentially deeper and more prolonged corrective phase. While the long-term fundamental outlook for gold may remain constructive, the current technical structure suggests downside risks continue to dominate, with the Head and Shoulders target near $92.68 serving as the next major reference point for investors. This update reflects a substantially more bearish technical outlook than the earlier Double Top analysis.


 Nov 12, 2026





 Please wait processing your request...