
 CA
 NZ
 UK
 US
 IND

 AU

 Share
 X (Formerly Twitter)
 Whatsapp
 Facebook
 LinkedIn
 Telegram
 Email This Article
 Copy Link
 Summarize with AI
 Chat GPT
 Perplexity

Highlights
- Newmont reported 20% year-on-year sales growth for Q3FY25, reaching USD 5,524 million.
- Net income attributable to stockholders nearly doubled to USD 1,832 million compared to Q3FY24.
- Production outlook for 2026 is expected to be at the lower end of 2025 guidance, impacted by mine sequencing and specific site outputs.
Newmont Corporation (ASX:NEM), a global gold producer with diversified operations in copper, zinc, lead, and silver, reported impressive financial results for the quarter ended 30 September 2025. Supported by mining assets across multiple continents including Africa, Australia, Latin America, and North America, Newmont’s Q3FY25 performance highlights growth driven by rising gold prices and efficient cost management. Despite operational challenges such as the recent bushfire at the Boddington mine, the company maintains a stable outlook for the remainder of FY25 and into 2026.
Quarterly Financial Results Reflect Revenue and Earnings Growth
Newmont posted sales of USD 5,524 million for Q3FY25, marking a 20% increase compared to USD 4,605 million during the same quarter last year. Net income attributable to Newmont stockholders almost doubled, reaching USD 1,832 million compared to USD 922 million in Q3FY24. Cash and cash equivalents surged 87% year-over-year to USD 5,639 million, indicating improved liquidity.
This growth was supported by a USD 219 rise in realized gold prices quarter-on-quarter, along with better cost control measures. Although production slightly decreased, the company’s reduced cash all-in sustaining costs (CAS) and all-in sustaining costs (AISC), plus lower income tax expenses, helped enhance profitability. These factors combined to boost adjusted net income and EBITDA during the quarter.
Impact of Boddington Bushfire
On 7 January 2026, Newmont provided an update on the December 2025 bushfire at its Boddington mine in Australia. The fire was contained by 28 December 2025, with no major injuries reported. While production was not directly affected, damage to water infrastructure is expected to reduce processing rates in early 2026. This may impact gold output by approximately 60,000 ounces during the first quarter of the new year.
Production Outlook
Looking ahead, Newmont anticipates fourth-quarter production to be consistent with Q3FY25 levels. The total attributable gold production for FY25 is forecasted at 5.9 million ounces. Production in 2026 is expected to be at the lower end of 2025 guidance, primarily due to mine sequencing plans and reduced output at Peñasquito and Yanacocha operations.
Cost Management and Sustainability Focus Underpin Future Strategy
Newmont’s ongoing cost-saving initiatives include reductions in general and administrative (G&A) expenses and exploration spending. Full-year cost guidance remains steady with moderate expected improvements in sustaining capital and development costs.
Free cash flow for Q4FY25 is projected to be negatively affected by increased investments in Yanacocha water treatment facilities and severance payments. These costs could offset some operational cash flow, though overall liquidity remains robust.
Share Performance of NEM
NEM shares fell sharply by 10.00% to close at AUD 155.96 on 2 February 2026. Over the past year, the stock has gained 133.99%. It has risen 3.83% over the past month but declined 12.62% over the last week and week-to-date. Over the last three months, the stock advanced 24.84%, while it increased 3.83% month-to-date and quarter-to-date.
The 52-week high for Newmont Corporation is AUD 190.54, recorded on 29 January 2026, and the 52-week low is AUD 65.69, reached on 28 January 2025.
Support and Resistance Summary
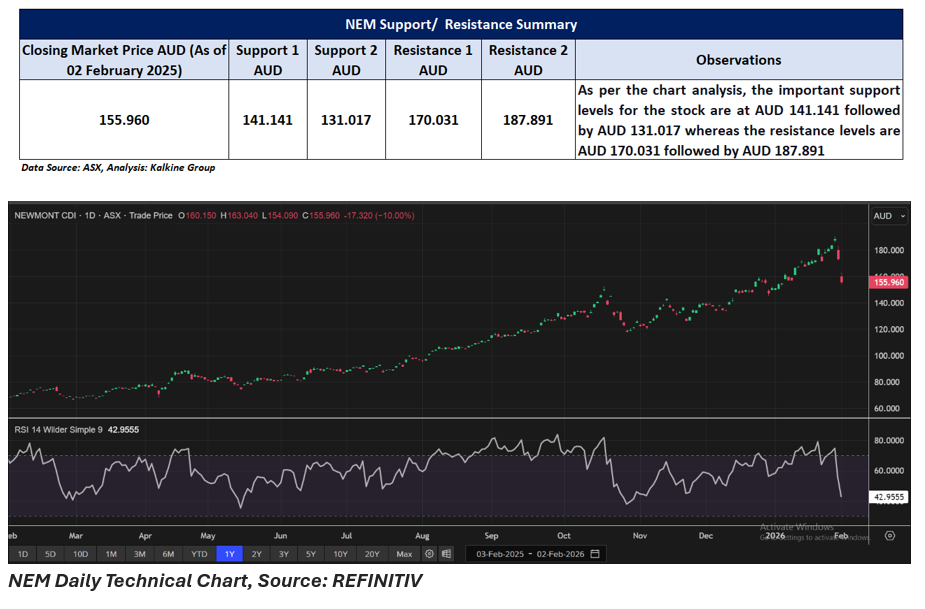
Note 1: Past performance is neither an Indicator nor a guarantee of future performance.
Note 2: The reference date for all price data, and currency, is 02 February 2026. The reference data in this report has been partly sourced from EODHD/Others.
Technical Indicators Defined:
Support: A level at which the stock prices tend to find support if they are falling, and a downtrend may take a pause backed by demand or buying interest. Support 1 refers to the nearby support level for the stock and if the price breaches the level, then Support 2 may act as the crucial support level for the stock.
Resistance: A level at which the stock prices tend to find resistance when they are rising, and an uptrend may take a pause due to profit booking or selling interest. Resistance 1 refers to the nearby resistance level for the stock and if the price surpasses the level, then Resistance 2 may act as the crucial resistance level for the stock.


 Nov 12, 2026





 Please wait processing your request...