
 CA
 NZ
 UK
 US
 IND

 AU

 Share
 X (Formerly Twitter)
 Whatsapp
 Facebook
 LinkedIn
 Telegram
 Email This Article
 Copy Link
 Summarize with AI
 Chat GPT
 Perplexity
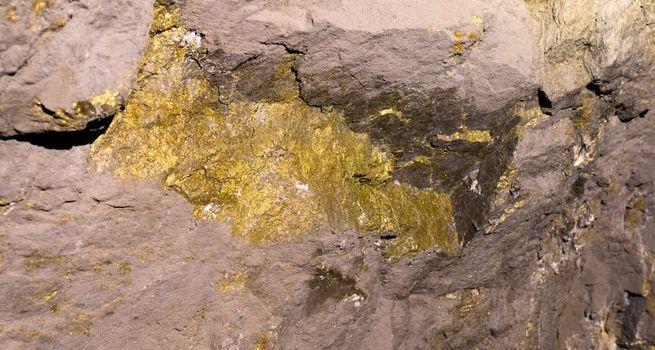
Image source: Shutterstock
Highlights
- NEM’s Q1FY25 revenue increased by 25% YoY to USD 5,010 million.
- The attributable gold production fell by 19% YoY, mainly due to lower output from non-core operations.
- NEM expects total attributable gold production for FY25 to be 5.9 million ounces.
Newmont Corporation (ASX:NEM) is an ASX-listed gold company with focus on copper, zinc, lead, and silver production as well. The company operates across key mining regions including Africa, Australia, Latin America, the Caribbean, North America, and Papua New Guinea.
In the first quarter of financial year 2025 (1QFY25), the company’s sales revenue increased 25% YoY to USD 5,010 million. Adjusted EBITDA for the period surged 55% YoY to USD 2,629 million, while operating cash flow rose 162% to USD 2,031 million. Quarterly performance was primarily driven by higher gold and copper prices, improved operational efficiency, strategic asset sales at lower cost, and a favourable investment revaluations.
During the reported period, attributable gold production fell by 19% YoY, due to lower output from non-core operations.
Recent Business Update
NEM has released its 2024 Sustainability and Tax Contribution Report in May 2025, outlining its environmental, social, and governance (ESG) performance and detailing USD 16 billion in total economic contributions.
Company Outlook
NEM expects total attributable gold production to reach 5.9 million ounces in FY25. In 1HFY25, Tier 1 gold production of nearly 48% is expected on back of development capital investments peaking early. In 2HFY25, production growth is expected to be supported by Nevada Gold Mines, Pueblo Viejo, and the Ahafo North ramp-up. The company is focused on steady gold and copper output through operational efficiency, mine expansion, and exploration.
Top 10 Shareholders of NEM
The top 10 shareholders of NEM have ~11.44% of the total shareholding. Jupiter Asset Management Ltd. has the highest stake in the firm with a shareholding of nearly 2.23%, followed by Schroder Investment Management (Hong Kong) Ltd. with ~2.11% shareholding.
Share performance of NEM
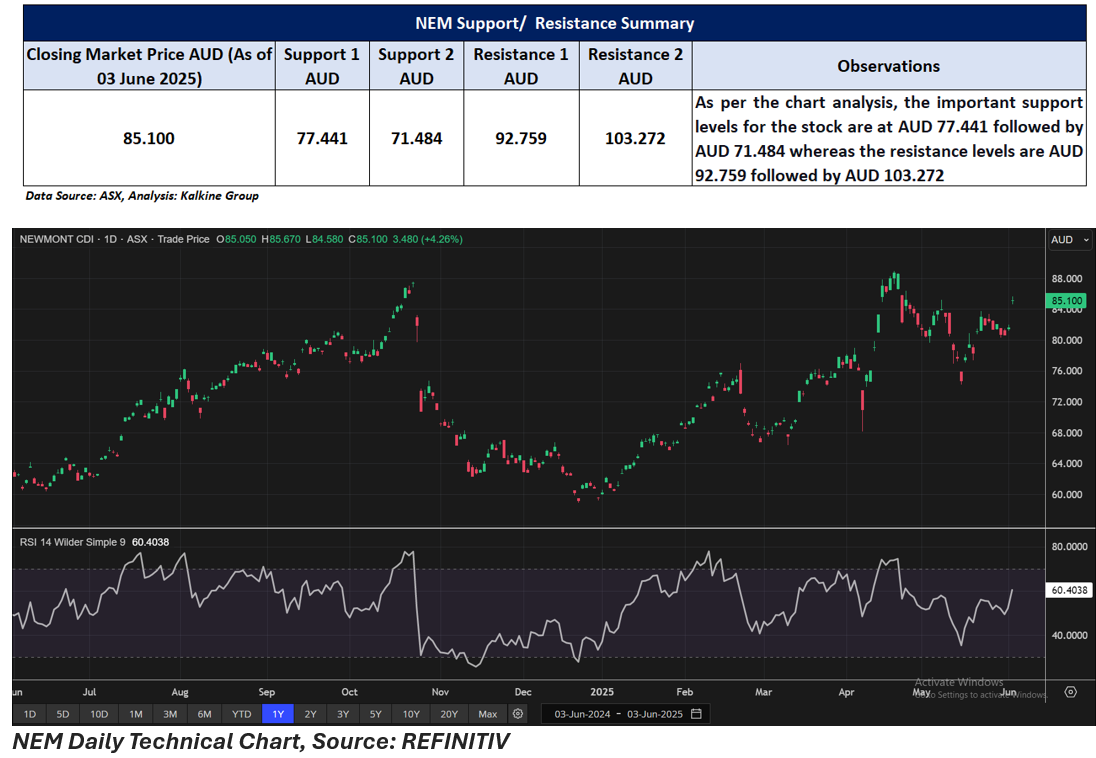
NEM shares climbed 4.26% on 2 June 2025 to close at AUD 85.10 per share. Over the last 12 months, the stock has delivered 36.53% return, with a notable 25.44% rise over the past three months. The stock is up 4.87% in a month and 35.38% over six months. NEM reached its 52-week high of AUD 88.93 on 17 April 2025 and its 52-week low of AUD 58.92 on 20 December 2024.
Support and Resistance Summary
Note 1: Past performance is neither an Indicator nor a guarantee of future performance.
Note 2: The reference date for all price data, and currency, is 03 June 2025. The reference data in this report has been partly sourced from EODHD/Others.
Technical Indicators Defined:
Support: A level at which the stock prices tend to find support if they are falling, and a downtrend may take a pause backed by demand or buying interest. Support 1 refers to the nearby support level for the stock and if the price breaches the level, then Support 2 may act as the crucial support level for the stock.
Resistance: A level at which the stock prices tend to find resistance when they are rising, and an uptrend may take a pause due to profit booking or selling interest. Resistance 1 refers to the nearby resistance level for the stock and if the price surpasses the level, then Resistance 2 may act as the crucial resistance level for the stock.


 Nov 12, 2026





 Please wait processing your request...