
 CA
 NZ
 UK
 US
 IND

 AU

 Share
 X (Formerly Twitter)
 Whatsapp
 Facebook
 LinkedIn
 Telegram
 Email This Article
 Copy Link
 Summarize with AI
 Chat GPT
 Perplexity

Key Highlights
- New Hope maintains a robust operational profile as a low-cost producer of high-quality thermal coal.
- The company continues to deliver exceptional cash flow, supporting its industry-leading dividend yield and capital management programs.
- Strategic approval for the New Acland Stage 3 project provides a long-term production runway for the group.
While New Hope Corporation Limited (ASX:NHC) remains a cornerstone of the Australian energy sector, the stock is currently at a technical crossroads that could define its trajectory for the remainder of 2026. Despite the "RBA Tightrope" and shifting global energy policies, New Hope is carving out a definitive structural base, suggesting that the period of post-peak correction may be concluding in favor of a new accumulation phase.
Cash Flow and Operational Longevity
NHC’s fundamental strength is rooted in its ability to generate significant liquidity while maintaining a high-yielding blue-chip profile:
- Thermal Coal Demand: As energy security remains a global priority, demand for NHC’s high-caloric thermal coal remains resilient, particularly within the Asian industrial heartlands, providing a stable revenue floor.
- Margin Preservation: Through disciplined operating expense management and the ramp-up of new production capacity, NHC has successfully protected its EBITDA margins even as spot prices moderate from historical highs.
- Shareholder Returns: The company’s balance sheet strength continues to allow for aggressive dividend payout ratios, making it a preferred vehicle for income-seeking investors in a volatile interest rate climate.
Associated Risks
The primary risk for New Hope remains the cyclicality of global coal pricing and potential regulatory headwinds regarding carbon inflation taxes. Furthermore, any logistical bottlenecks in the coal supply chain or unexpected increases in capital expenditure for site development could impact short-term earnings per share.
Technical Outlook
The technical chart for New Hope reveals a classic bullish reversal pattern that has been meticulously developing over several months, signaling a potential end to the recent corrective trend.
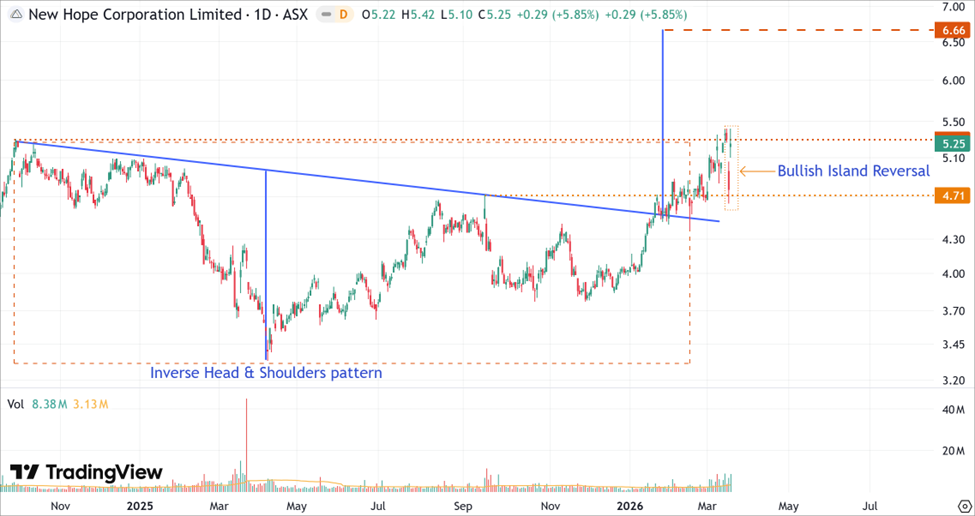
NHC’s Daily Price Chart (at the closing price of 18th March 2026). Powered by: tradingview.com
- On the daily chart, NHC completed an Inverse Head and Shoulders pattern spanning from early 2025 through 2026.
- After a pullback from the significant resistance at the April 2024 peak of $5.36, the stock has formed a Bullish Island Reversal candlestick formation near the pattern’s neckline, indicating a reversal to the upside soon.
- The pattern’s projected target is placed at $6.66, which serves as the primary price target in the long-term.
Bottom Line
New Hope Corporation (ASX:NHC) is a story of fundamental energy resilience meeting a high-conviction technical breakout. While the broader market grapples with sector rotation, the technicals suggest that NHC is being re-rated as a primary beneficiary of the sustained energy cycle. Until the $5.36 level is decisively cleared, some consolidation should be expected, but a confirmed breakout would open the path toward significant long-term upside.


 Nov 12, 2026





 Please wait processing your request...