
 CA
 NZ
 UK
 US
 IND

 AU

 Share
 X (Formerly Twitter)
 Whatsapp
 Facebook
 LinkedIn
 Telegram
 Email This Article
 Copy Link
 Summarize with AI
 Chat GPT
 Perplexity

Key Highlights
- National Australia Bank's technical posture has rapidly deteriorated, with the stock suffering a severe -2.40% cyclical sell-off.
- The macroeconomic narrative of peaking interest rates and structurally compressed Net Interest Margins (NIM) is triggering active, large-scale institutional distribution.
- The technical price action is flashing a confirmed structural breakdown, having aggressively fractured the critical neckline of a massive, multi-month Head & Shoulders distribution pattern.
While National Australia Bank Limited (ASX:NAB) spent the vast majority of the past year riding a relentless and highly lucrative primary uptrend, the technical landscape has just suffered a definitive and catastrophic structural failure. As the broader market rigorously scrutinizes the extreme valuation multiples of the "Big Four" banks against a backdrop of peaking interest rates and sticky inflation, NAB has officially succumbed to a severe phase of institutional distribution. The recent deterioration in price action confirms that the long-term mark-up phase is dead, unleashing a dynamic new cyclical downtrend.
Margin Compression and Valuation Reality
NAB’s fundamental investment thesis is heavily anchored to the domestic credit cycle and its elite position as Australia’s premier business bank:
- Net Interest Margin (NIM) Squeeze: The primary profit engine for retail banks is facing acute pressure. While higher interest rates initially boosted margins, intense, margin-destroying competition for both home loans and customer deposits has forced the bank to absorb higher funding costs, structurally compressing core profitability.
- Credit Quality Deterioration: In a "higher-for-longer" interest rate environment, household and corporate balance sheets are increasingly stressed. The market is pre-emptively pricing in a highly probable uptick in bad and doubtful debt provisions as borrowers transition off fixed-rate mortgages and business insolvencies rise.
- Valuation Exhaustion: The massive 2025 rally pushed NAB's Price-to-Earnings (P/E) and Price-to-Book (P/B) multiples to extreme historical premiums. Institutional capital is now actively unwinding these positions, refusing to pay flawless growth valuations for a mature, cyclical banking asset facing a slowing macroeconomic environment.
Associated Risks
The primary risk for NAB, and the broader Australian banking sector, is a "hard landing" economic scenario. If a severe domestic recession triggers a sudden and aggressive spike in unemployment, the resulting wave of mortgage defaults and business bankruptcies would devastate the bank's balance sheet. Furthermore, any unexpected regulatory interventions by APRA requiring banks to hold even higher capital buffers would directly compress Return on Equity (ROE) and threaten the sustainability of its lucrative dividend payout ratio.
Technical Outlook
The daily chart for National Australia Bank reveals a rapid deterioration in market structure, highlighting a textbook masterclass in institutional distribution and a violent structural breakdown.
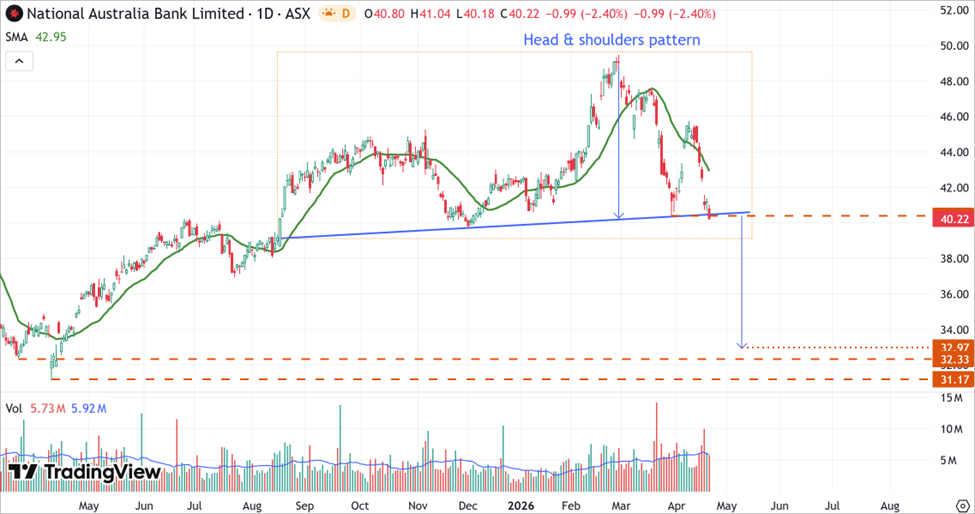
NAB’s Daily Price Chart (at the closing price of 23rd April 2026). Powered by: tradingview.com
- On the daily chart, NAB’s stock price has completed a Head and Shoulders pattern, suggesting a short-term trend reversal from an uptrend to a downtrend.
- With the primary breakdown of the pattern’s neckline confirmed below the $40.22 level, the price action paves the way for the pattern's full measured move, projecting a downside target of $32.09. This aligns with a significant support zone established by the March to April 2025 trough between $32.33 and $31.17.
Bottom Line
National Australia Bank (ASX:NAB) is currently exhibiting the classic hallmarks of a severe cyclical breakdown. The stock has suffered massive technical damage by fracturing the neckline of a prolonged Head & Shoulders distribution pattern. Closing weakly at $40.22 (-2.40%) and trapped well below its $42.95 dynamic resistance, the stock is now operating in a highly toxic technical environment. Investors and active traders should exercise extreme caution; the confirmed structural breakdown definitively ends the multi-year bull cycle and heavily favors a continued, devastating descent toward the $32.97 measured move target.


 Nov 12, 2026





 Please wait processing your request...