
 CA
 NZ
 UK
 US
 IND

 AU

 Share
 X (Formerly Twitter)
 Whatsapp
 Facebook
 LinkedIn
 Telegram
 Email This Article
 Copy Link
 Summarize with AI
 Chat GPT
 Perplexity

Key Highlights
- National Australia Bank is facing intensifying macroeconomic headwinds, with peak cash rates threatening to compress Net Interest Margins (NIM) amid fierce retail mortgage competition.
- Following a historic, multi-year cyclical advance, institutional capital appears to be systematically distributing shares as sector valuation multiples stretch to extreme historical premiums.
- The technical price action is flashing severe warning signs, characterized by the ominous development of a massive, multi-month Head & Shoulders distribution pattern.
While National Australia Bank Limited (ASX:NAB) spent the vast majority of the past year riding a relentless and highly lucrative primary uptrend, the technical landscape has recently undergone a definitive shift toward structural exhaustion. As the broader market rigorously scrutinizes the extreme valuation multiples of the "Big Four" banks against a backdrop of peaking interest rates and sticky inflation, NAB appears to be succumbing to a severe phase of institutional distribution. The recent deterioration in price action suggests that the long-term mark-up phase has exhausted, threatening to unleash a dynamic new cyclical downtrend.
Margin Compression and Valuation Reality
NAB’s fundamental investment thesis is heavily anchored to the domestic credit cycle and its elite position as Australia’s premier business bank:
- Net Interest Margin (NIM) Squeeze: The primary profit engine for retail banks is facing acute pressure. While higher interest rates initially boosted margins, intense, margin-destroying competition for both home loans and customer deposits has forced the bank to absorb higher funding costs, structurally compressing core profitability.
- Credit Quality Deterioration: In a "higher-for-longer" interest rate environment, household and corporate balance sheets are increasingly stressed. The market is pre-emptively pricing in a highly probable uptick in bad and doubtful debt provisions as borrowers transition off fixed-rate mortgages and business insolvencies rise.
- Valuation Exhaustion: The massive 2025 rally pushed NAB's Price-to-Earnings (P/E) and Price-to-Book (P/B) multiples to extreme historical premiums. Institutional capital is increasingly hesitant to pay flawless growth valuations for a mature, cyclical banking asset facing a slowing macroeconomic environment.
Associated Risks
The primary risk for NAB, and the broader Australian banking sector, is a "hard landing" economic scenario. If a severe domestic recession triggers a sudden and aggressive spike in unemployment, the resulting wave of mortgage defaults and business bankruptcies would devastate the bank's balance sheet. Furthermore, any unexpected regulatory interventions by APRA (Australian Prudential Regulation Authority) requiring banks to hold even higher capital buffers would directly compress Return on Equity (ROE) and threaten the sustainability of its lucrative dividend payout ratio.
Technical Outlook
The daily chart for National Australia Bank reveals a rapid deterioration in market structure, highlighting a textbook masterclass in institutional distribution and buyer exhaustion.
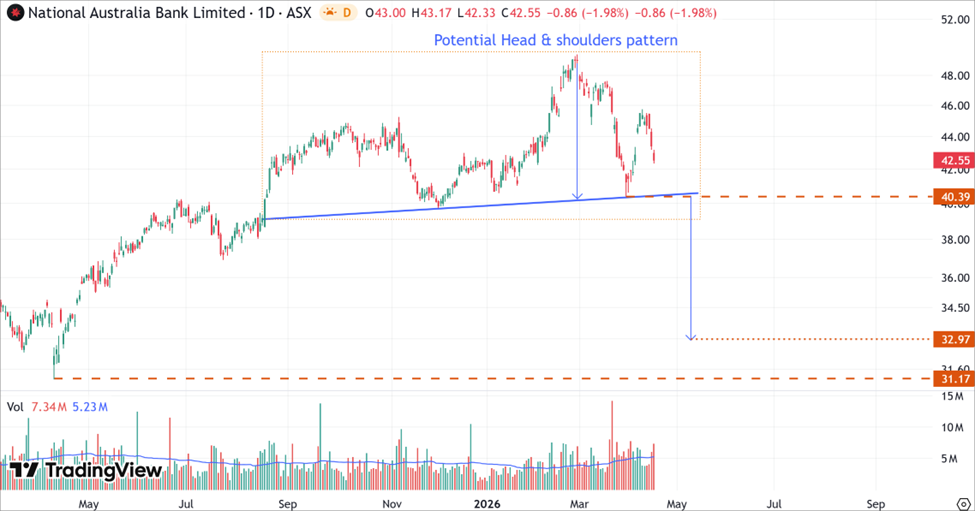
NAB’s Daily Price Chart (at the closing price of 17th April 2026). Powered by: tradingview.com
- On the daily chart, NAB’s stock price has developed a potential head and shoulders pattern spanning to August 2026, indicating a negative bias.
- A decisive structural breakdown and daily close below the pattern’s neckline at $40.39 would open the door to its full measured move, which projects a devastating primary downside target of $32.97.
Bottom Line
National Australia Bank (ASX:NAB) is currently exhibiting the classic hallmarks of an impending cyclical breakdown. The stock is suffering severe technical damage as it actively carves out the right shoulder of a massive Head & Shoulders distribution pattern on elevated selling volume. While the structural breakdown is not yet confirmed, the technical posture is highly vulnerable. Investors and active traders should exercise extreme caution and closely monitor the critical $40.39 ascending neckline. A confirmed fracture of this support zone would definitively end the multi-year bull cycle and heavily favor a continued, devastating descent toward the $32.97 measured move target.


 Nov 12, 2026





 Please wait processing your request...