
 CA
 NZ
 UK
 US
 IND

 AU

 Share
 X (Formerly Twitter)
 Whatsapp
 Facebook
 LinkedIn
 Telegram
 Email This Article
 Copy Link
 Summarize with AI
 Chat GPT
 Perplexity

Key Highlights
- NAB has completed a small inverse head and shoulders pattern, indicating that the recent correction phase may be ending.
- The bullish reversal has emerged following the completion of a larger-scale head and shoulders pattern that drove the stock lower during the first half of 2026.
- The stock has broken above neckline resistance near $38.82, confirming the inverse head and shoulders breakout.
- The recovery is occurring after the stock successfully defended a major support zone near $38.05.
- Based on the pattern's measured-move projection, the initial technical target is located near $42.35.
While National Australia Bank Limited (ASX: NAB) experienced considerable volatility during the first half of 2026, the stock now appears to be stabilising following a sizeable correction. After completing a large-scale head and shoulders pattern that triggered a decline from the March highs, NAB has subsequently formed and completed a smaller inverse head and shoulders pattern near key support levels. This transition from a bearish reversal pattern to a bullish reversal pattern suggests investor sentiment may be improving toward one of Australia's largest banking institutions.
Strong Capital Position and Banking Sector Leadership
NAB remains one of Australia's leading banking groups, supported by a diversified business model spanning retail banking, business lending, wealth management, and institutional banking services. The bank continues to benefit from its strong market position, disciplined risk management framework, and robust capital base, allowing it to navigate changing economic and interest-rate environments.
The company also offers an attractive dividend profile supported by consistent earnings generation and strong cash flow. In addition, ongoing investments in digital banking capabilities, customer experience initiatives, and operational efficiency programs continue to strengthen its long-term competitive position. These factors provide a supportive fundamental backdrop for the stock's recent technical recovery.
Associated Risks
Despite the improving technical outlook, NAB remains exposed to risks associated with economic growth, credit quality, interest-rate movements, and regulatory developments. A deterioration in economic conditions could impact loan demand and increase impairment expenses across the banking sector.
In addition, the recent breakout remains relatively fresh. Failure to hold above the neckline support near $38.82 could result in renewed selling pressure and a retest of lower support levels.
Technical Analysis Outlook
NAB's daily chart is displaying a developing recovery following a significant bearish reversal earlier this year. While short-term momentum has improved, the broader technical picture remains influenced by the larger head and shoulders pattern completed during the first half of 2026.
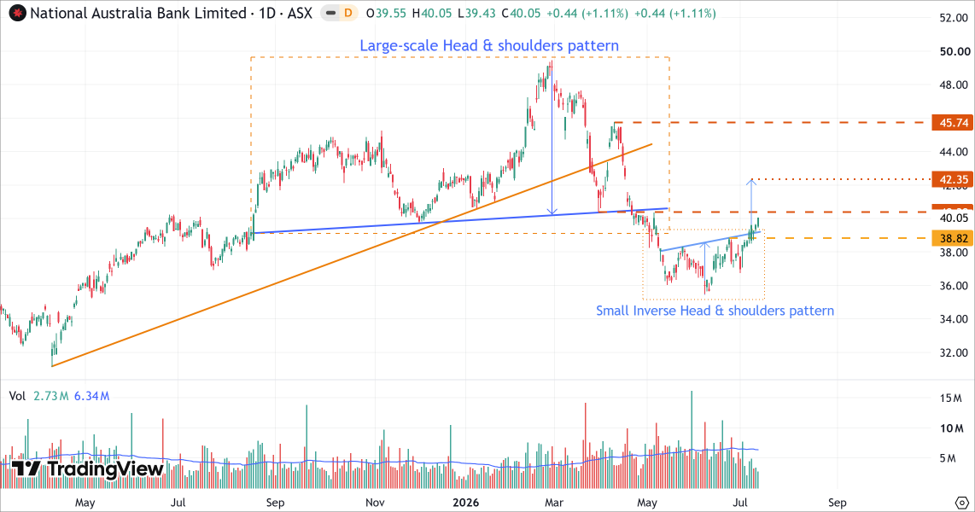
NAB's Daily Price Chart (at the closing price of 13/07/2026). Powered by: tradingview.com
- On the daily chart, NAB previously completed a large-scale head and shoulders pattern, generating a significant bearish signal and marking the end of the strong uptrend that had been in place since 2024. The subsequent decline confirmed the pattern and shifted the broader technical bias to the downside.
- Following the correction, the stock has developed a smaller inverse head and shoulders pattern. The recent breakout above the neckline resistance near $38.82 confirms a short-term recovery and suggests that selling pressure has eased.
- Based on the pattern's measured-move projection, the initial upside target is located near $42.35.
- Despite the improving near-term outlook, investors should recognise that the current advance remains a recovery within the context of the larger bearish reversal pattern. Until the stock decisively overcomes the overhead resistance level at $45.74, the broader implications of the large-scale head and shoulders pattern remain intact.
- A decisive breakout above $45.74 would weaken the bearish implications of the larger head and shoulders pattern and provide stronger evidence that a broader trend reversal is underway. Until then, the current move should be viewed primarily as a short-term recovery within a broader corrective structure.
Bottom Line
National Australia Bank Limited (ASX: NAB) appears to be undergoing a short-term recovery after completing a sizeable correction triggered by a large-scale head and shoulders pattern earlier this year. The successful breakout from a smaller inverse head and shoulders formation suggests selling pressure has eased and that buyers are attempting to regain control of the trend.
However, investors should recognise that the broader bearish implications of the larger head and shoulders pattern remain in place. While the breakout above $38.82 has improved the near-term outlook and opened the door for a move towards $42.35, the stock must decisively overcome the key resistance level at $45.74 before a broader bullish reversal can be confirmed. Until then, the current advance should be viewed primarily as a recovery within a broader corrective structure.


 Nov 12, 2026





 Please wait processing your request...