
 CA
 NZ
 UK
 US
 IND

 AU

 Share
 X (Formerly Twitter)
 Whatsapp
 Facebook
 LinkedIn
 Telegram
 Email This Article
 Copy Link
 Summarize with AI
 Chat GPT
 Perplexity

Image source: Shutterstock
Highlights
- NAB reported total dividends of 169 cents per share in FY24, up 1.2% YoY, maintaining a 73.7% payout ratio.
- Profit after tax dropped by 6.1% YoY to AUD 6.96 billion in FY24 and cash earnings declined by 8.1% YoY.
- FY25 strategy targets AUD 400 million in productivity savings and digital transformation to enhance efficiency.
National Australia Bank Limited (ASX:NAB) is one of Australia’s major financial institutions. In the financial year ended 30 September 2024 (FY24), NAB’s net operating income remained flat at AUD 20.65 billion compared to the prior year. However, profit after tax declined 6.1% YoY to AUD 6.96 billion, while cash earnings fell by 8.1% YoY to AUD 7.10 billion. These results came amid pressures such as rising cost-of-living and interest rate challenges, particularly in the first half of the fiscal year.
The bank noted that conditions improved in 2HFY24, supported by a more stable operating environment and proactive customer support.
Despite the profit decline, NAB declared a fully franked dividend of 169 Australian cents per share, up 1.2% from 2023, translating to a payout ratio of 73.7%—comfortably within its 65–75% target range.
Strategic Priorities for FY25
Looking ahead, NAB has sharpened its focus on driving digital transformation and operational efficiency. For FY25, the bank is targeting over AUD 400 million in productivity savings, aiming to reduce operating expense growth below FY24’s 4.5% rise. The strategy includes streamlining operations, advancing customer experience through technology, and simplifying processes for seamless banking.
The implementation of NAB’s refreshed strategy is already underway, emphasizing customer centricity, digital innovation, and end-to-end operational improvements.
Resilience Amid Economic Uncertainty
Although market conditions remain challenging due to inflation and household cost pressures, NAB remains optimistic. The bank expects economic conditions to gradually improve in 2025, potentially aided by easing interest rates in the first half of the year.
Share performance of NAB
NAB shares closed 0.36% lower at AUD 36 per share on 1 May 2025. Over the past year, NAB’s share price has increased by almost 6.54% and in the three months, it has dropped by approximately 9.77%.
52-week high of NAB is AUD 41.68, recorded on 13 February 2025 and 52-week low is AUD 31.13, recorded on 7 April 2025.
Support and Resistance Summary
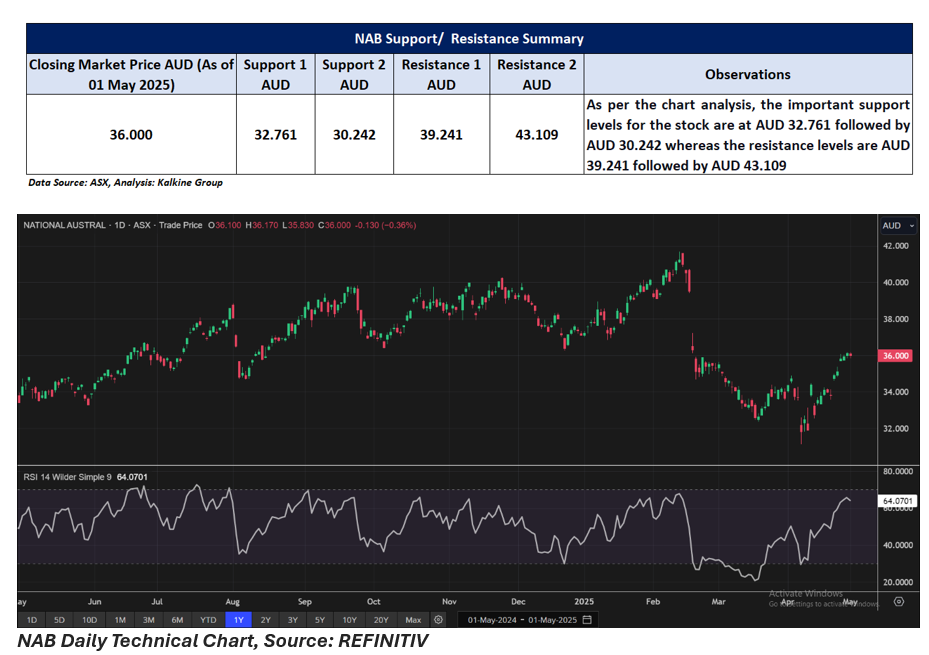
Note 1: Past performance is neither an Indicator nor a guarantee of future performance.
Note 2: The reference date for all price data, and currency, is 01 May 2025. The reference data in this report has been partly sourced from EODHD/Others.
Technical Indicators Defined:
Support: A level at which the stock prices tend to find support if they are falling, and a downtrend may take a pause backed by demand or buying interest. Support 1 refers to the nearby support level for the stock and if the price breaches the level, then Support 2 may act as the crucial support level for the stock.
Resistance: A level at which the stock prices tend to find resistance when they are rising, and an uptrend may take a pause due to profit booking or selling interest. Resistance 1 refers to the nearby resistance level for the stock and if the price surpasses the level, then Resistance 2 may act as the crucial resistance level for the stock.


 Nov 12, 2026





 Please wait processing your request...