
 CA
 NZ
 UK
 US
 IND

 AU

 Share
 X (Formerly Twitter)
 Whatsapp
 Facebook
 LinkedIn
 Telegram
 Email This Article
 Copy Link
 Summarize with AI
 Chat GPT
 Perplexity

Metcash Limited (ASX: MTS): Head and Shoulders Pattern Threatens to Reverse Earlier Bullish Breakout
Key Highlights
- MTS previously completed an Inverse Head and Shoulders pattern, signalling the potential start of a recovery from its 2025 downtrend.
- However, the stock has subsequently formed a Head and Shoulders pattern, creating a significant technical battle between bullish and bearish forces.
- A Falling Window (bearish gap) remains visible near recent highs, suggesting overhead selling pressure continues to cap advances.
- The key support level is located near $2.92, corresponding to both the neckline of the Head and Shoulders pattern and the right shoulder area of the earlier Inverse Head and Shoulders formation.
- A decisive breakdown below $2.92 would invalidate the previous bullish pattern and could signal the resumption of the broader downtrend, with an initial downside target near $2.58.
Metcash Limited (ASX: MTS) finds itself at an important technical crossroads after forming a Head and Shoulders pattern following an earlier Inverse Head and Shoulders breakout. While the previous bullish reversal suggested the stock was attempting to establish a sustainable recovery, the subsequent emergence of a bearish reversal pattern raises the possibility that the recovery may be losing momentum. The next move around the critical $2.92 support zone could prove decisive in determining the stock's medium-term direction.
Business Fundamentals Remain Defensive
Metcash continues to benefit from its diversified wholesale distribution model and defensive exposure to essential consumer spending.
Metcash operates across food, liquor, and hardware distribution through well-known networks including IGA, Mitre 10, Total Tools, and Cellarbrations. The company's diversified business structure helps reduce reliance on any single segment and provides a degree of earnings stability during periods of economic uncertainty.
In addition, Metcash's exposure to essential consumer products and hardware markets provides defensive characteristics that have historically supported cash flow generation and dividend distributions. While competitive pressures and changing consumer spending patterns remain ongoing challenges, the company continues to maintain a solid market position across its core operating segments.
Associated Risks
Despite its defensive business model, investors should remain aware of several risks.
The company operates in highly competitive retail and wholesale markets where margin pressure can arise from intense competition, changing consumer preferences, and fluctuating supplier costs. Economic weakness may also affect discretionary spending within its liquor and hardware divisions.
Furthermore, higher operating costs, supply chain disruptions, and execution risks associated with acquisitions or business integration initiatives could impact future profitability.
Technical Outlook
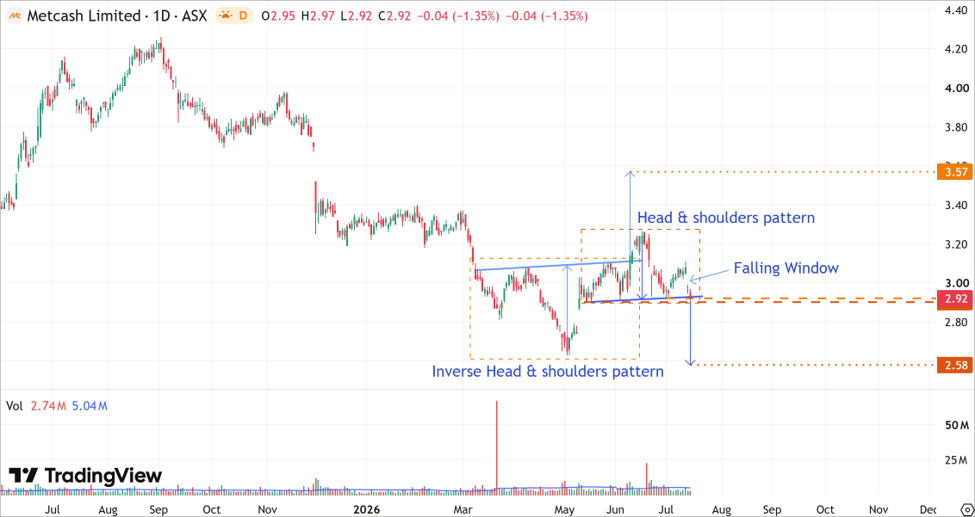
MTS's Daily Price Chart (at the closing price of 16/07/2026). Powered by: tradingview.com
- On the daily chart, MTS previously completed an Inverse Head and Shoulders pattern, signalling that a recovery phase could be underway after a prolonged decline. The breakout initially improved the stock's technical outlook and suggested buyers were regaining control.
- However, the stock subsequently formed a Head and Shoulders pattern following the earlier bullish breakout. This development introduces a significant bearish risk because it suggests the recovery may have stalled before evolving into a sustainable uptrend.
- Adding to the cautionary outlook, a Falling Window (bearish gap) remains visible near recent highs. In technical analysis, such gaps often act as resistance zones and indicate that sellers continue to exert influence over price action.
- The key battleground is located near $2.92, which represents the neckline support of the Head and Shoulders pattern and coincides closely with the right shoulder area of the earlier Inverse Head and Shoulders formation. This level therefore carries considerable technical significance.
- If the stock decisively breaks below $2.92, the earlier Inverse Head and Shoulders pattern would effectively fail. Failed bullish patterns often carry bearish implications, as they indicate that buyers were unable to maintain control following the breakout. In this scenario, the broader downtrend could resume, with an initial downside target near $2.58.
Bottom Line
Metcash Limited (ASX: MTS) is approaching a critical technical inflection point. While the stock previously completed an Inverse Head and Shoulders pattern that suggested a recovery was underway, the subsequent formation of a Head and Shoulders pattern raises the risk that the bullish breakout may fail.
The key level to watch is $2.92. A decisive breakdown below this support would invalidate the earlier bullish pattern and increase the likelihood of a renewed decline toward $2.58. Until buyers demonstrate they can defend this level and overcome the Falling Window resistance, caution remains warranted despite the company's fundamentally defensive business profile.


 Nov 12, 2026





 Please wait processing your request...