
 CA
 NZ
 UK
 US
 IND

 AU

 Share
 X (Formerly Twitter)
 Whatsapp
 Facebook
 LinkedIn
 Telegram
 Email This Article
 Copy Link
 Summarize with AI
 Chat GPT
 Perplexity

Key Highlights
- Strategic investments in technology-enablement are yielding tangible results, with "Customers per FTE" rising 14.1% in the first half of FY26.
- Group revenue reached $297.4 million for 1HFY26, an 11.2% increase driven by growth across all business segments.
- The board has authorized an on-market share buyback of up to $10 million, complementing a 62-cent fully franked interim dividend.
- A large-scale "Head & Shoulders" pattern has completed on the daily chart, signaling a major trend reversal despite positive earnings growth.
Though fundamentals are strong, technicals are saying a different story for McMillan Shakespeare (ASX:MMS), as the price action begins to reflect significant distribution that contradicts the company’s internal growth metrics.
Fundamental Drivers
While the narrative remains robust, driven by a 14.1% uptick in customer efficiency and an expanded digital-first strategy, McMillan Shakespeare (ASX:MMS) is navigating a period of sharp divergence between its solid fundamental performance and deteriorating technical price action. The current market response suggests that near-term operational challenges and specific pattern formations are overriding the long-term growth story. Investors must weigh promising underlying revenue momentum against clear chart warnings.
Associated Risks
This confluence of technical triggers occurred simultaneously with significant strategic adjustments, particularly regarding the removal of NDIS setup fees in the PSS segment starting July 2025, a move projected to compress margins. Although the company has launched a $10 million share buyback and maintains a 62-cent fully franked interim dividend, these capital management tactics may not be sufficient to restore near-term confidence given the current heavy distribution. The stock now risks testing deeper support levels as it moves toward its pattern-projected target of $12.36.
Technical Outlook
Multiple warning signs have emerged for this stock since it peaked in August 2025.
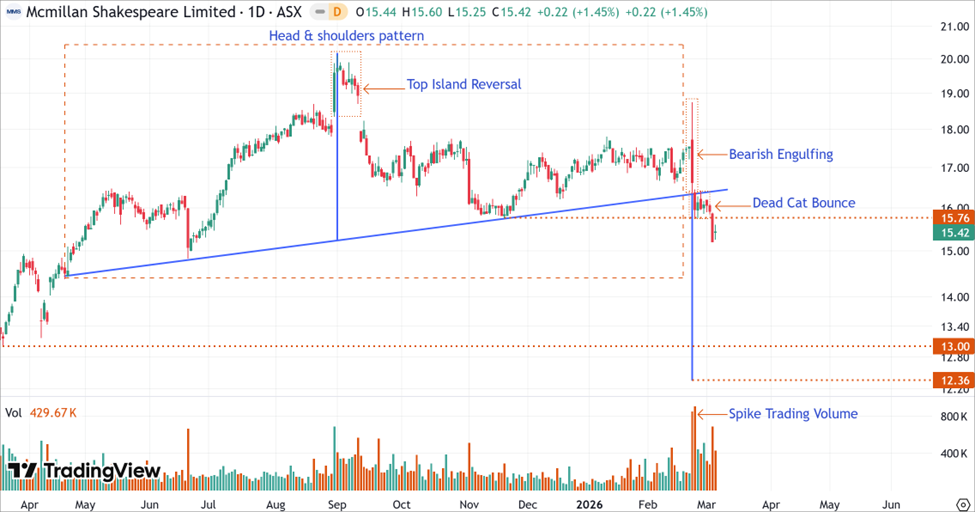
MMS’s Daily Price Chart (at the closing price of 05th March 2026). Powered by: tradingview.com
- A confluence of bearish signals has developed following the August 2025 peak, including: a Top Island Reversal on 10 September 2025; a Bearish Engulfing on 23 February 2026; and the completion of a Head and Shoulders pattern coupled with a volume spike on 24 February 2026. This was followed by a Dead Cat Bounce from 25 February to 3 March 2026, and a breakdown of the previous trough on strong volume on 4 March 2026.
- The formation projects a price objective of $12.36, representing the short-term price objective for the stock. While this level sits below the March 2025 support floor at $13.00, a relief rally or pullback may occur near that support zone before the target is fully realized.
Bottom Line
Despite its strong fundamental transformation, the market is aggressively discounting McMillan Shakespeare as key technical warning signs, including a massive head and shoulders completion and immediate bearish confirmations, signal that heavy selling pressure persists. While its digital focus provides a solid long-term defensive layer, new accumulation should likely be deferred until clearer signs of stabilization emerge.


 Nov 12, 2026





 Please wait processing your request...