
 CA
 NZ
 UK
 US
 IND

 AU

 Share
 X (Formerly Twitter)
 Whatsapp
 Facebook
 LinkedIn
 Telegram
 Email This Article
 Copy Link
 Summarize with AI
 Chat GPT
 Perplexity

Key Highlights
- Mader Group Limited (ASX:MAD) is a global provider of specialist technical services across multiple industries, with operations spanning Australia, North America and other international markets.
- The company reported record 1H FY26 Revenue of $485.2 million, up 18% year-on-year, while NPAT increased 17% to $30.5 million.
- Mader remains on track for FY26 revenue of at least $1 billion and NPAT of at least $65 million, according to its 1H FY26 update.
- Technically, MAD has broken below a significant rising Trendline that had provided support since its earlier recovery.
- A Bearish Engulfing candlestick has appeared following the breakdown, signalling increased selling pressure.
- MAD closed at $6.42 on the latest chart, below the $6.74 and $7.04 levels highlighted on the chart.
- Trading Volume expanded sharply to approximately 545,000 shares compared with an average of around 95,000, providing strong confirmation of the recent bearish move.
- The $5.31 level represents the next major support area shown on the chart.
Mader Group Limited (ASX: MAD) has reached an important technical inflection point after breaking below a rising trendline that had supported the share price during its previous recovery. The Daily Chart shows a decisive decline through this trendline, followed by a Bearish Engulfing pattern and substantially higher trading volume. This combination indicates that selling pressure has strengthened and has weakened the stock's previous bullish technical structure.
Strong Fundamental Backdrop
Mader Group has continued to deliver strong operational growth despite the recent deterioration in its share-price momentum. The company reported record 1H FY26 revenue of $485.2 million, representing an 18% increase from the prior corresponding period. NPAT increased 17% to $30.5 million, while net Debt declined to $3.6 million.
Growth was broad-based across the company's geographic operations. Australian revenue increased 19% year-on-year to $384.6 million, North American revenue rose 13% to $90.0 million, and Rest of World revenue increased 36% to $10.6 million. Mader also reaffirmed FY26 guidance of at least $1 billion in revenue and at least $65 million in NPAT.
This combination of strong revenue growth, improving profitability and a strengthening Balance Sheet provides a supportive fundamental backdrop. However, the recent technical deterioration suggests that short- to medium-term price momentum has weakened despite the company's positive operating performance.
Associated Risks
The most immediate concern is the breakdown below the rising trendline. MAD has moved decisively beneath this support structure, meaning the previous bullish trend has been weakened. A recovery above the broken trendline would be required to significantly reduce the bearish signal.
The $6.74 and $7.04 levels are important areas to monitor on any recovery. A sustained move back above these levels would indicate that buyers are regaining control. Conversely, continued trading below them would reinforce the bearish structure and increase the risk of further downside.
Trading volume provides additional confirmation of the breakdown. The latest session recorded approximately 545,000 shares traded against an average of around 95,000, indicating that the decline occurred alongside substantially stronger market participation.
Mader also remains exposed to the cyclical nature of Mining and industrial services. Changes in Commodity prices, mining investment, labour availability and customer Capital Expenditure could affect Demand for its services. International expansion also introduces additional operational and execution risks.
Technical Outlook
MAD's daily chart suggests that its previous recovery has lost momentum after the stock broke below a rising trendline and formed a Bearish Engulfing pattern.
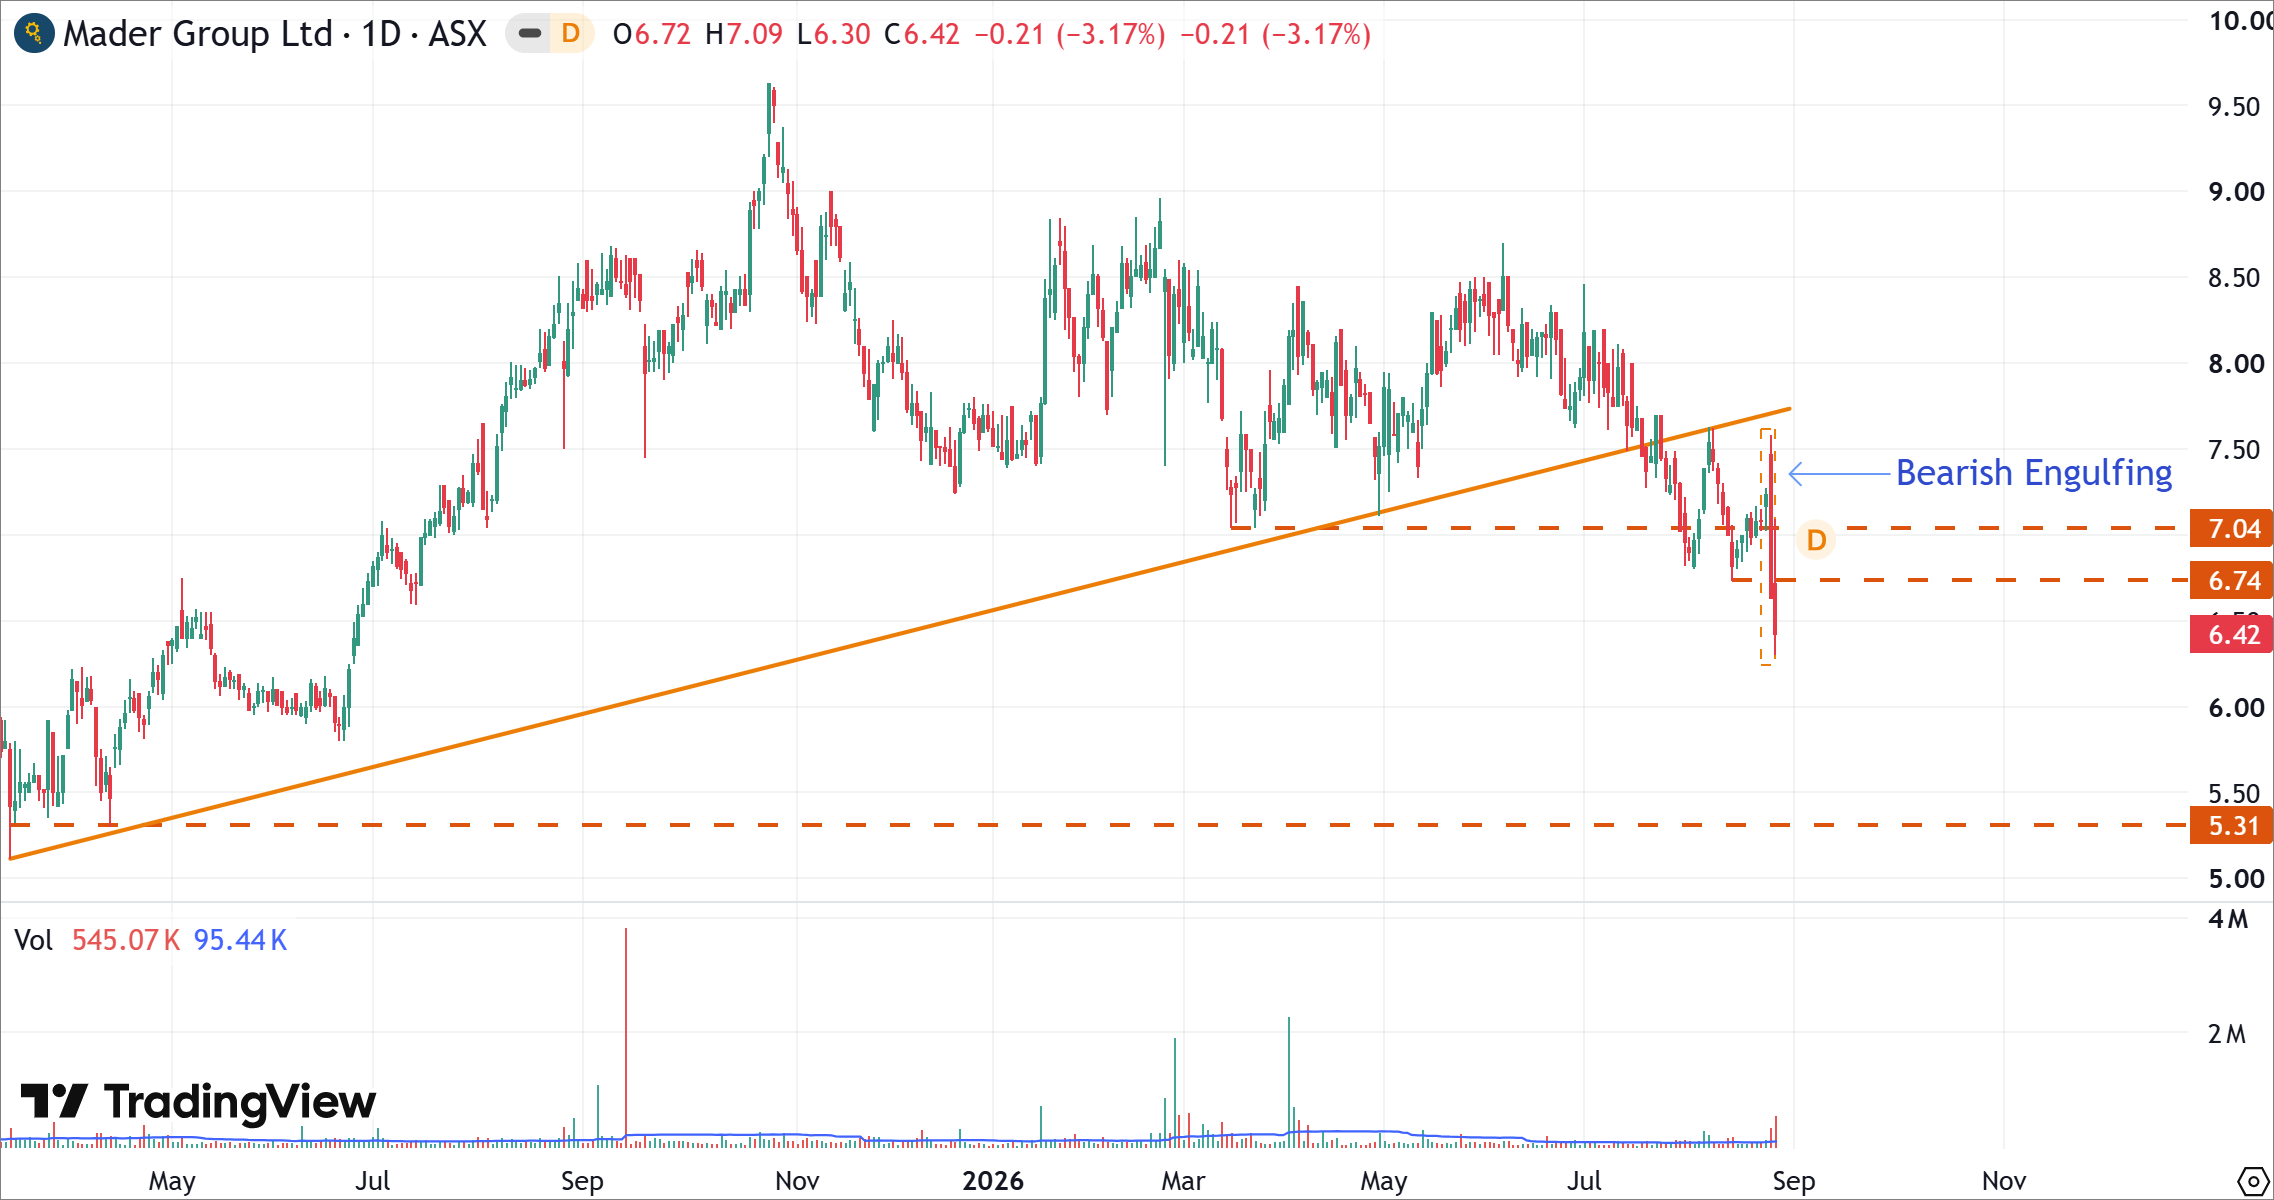
LOV's Daily Price Chart (at the closing price of 26/08/2026). Powered by: tradingview.com.
- MAD has broken below the orange rising trendline that had provided underlying support during the previous medium-term recovery.
- A Bearish Engulfing pattern has appeared around the $7.50 area, highlighting a sharp Reversal in short-term price momentum.
- Trading volume expanded sharply to approximately 545,000 shares compared with an average of around 95,000, providing strong confirmation of increased selling pressure.
- The $6.74 level is now an important potential resistance area, while $7.04 represents a higher resistance level that would need to be reclaimed to materially improve the technical structure.
- The $5.31 level represents the next major support area shown on the chart if the selling pressure persists.
- A sustained recovery above the broken rising trendline would weaken the bearish setup, while continued trading below $6.74 would increase the likelihood of further downside.
Bottom Line
Mader Group's record 1H FY26 revenue, strong NPAT growth, declining net debt and reaffirmed FY26 growth targets provide a supportive longer-term fundamental backdrop.
Technically, however, MAD has experienced a significant deterioration in its short- to medium-term structure. The stock has broken below its rising trendline and formed a Bearish Engulfing pattern, with the move accompanied by substantially higher trading volume.
The $5.31 level represents the next major support area shown on the chart. The $6.74 and $7.04 levels are now important resistance zones. Unless MAD can recover above these levels and regain the broken trendline, the bearish setup remains intact and further downside risk should be considered.


 Nov 12, 2026





 Please wait processing your request...