
 CA
 NZ
 UK
 US
 IND

 AU

 Share
 X (Formerly Twitter)
 Whatsapp
 Facebook
 LinkedIn
 Telegram
 Email This Article
 Copy Link
 Summarize with AI
 Chat GPT
 Perplexity

Image source: © 2025 Krish Capital Pty. Ltd.
Highlights
- In FY25, MAQ’s revenue grew 1.7% YoY to AUD 363.3 million, supported by Data Centre segment performance.
- EBITDA rose 4.1% YoY to AUD 113.6 million and NPAT increased 5.7% YoY to AUD 34.9 million in FY25.
- Ongoing investments in talent, AI capabilities, and data centre expansion underpin future growth outlook.
Macquarie Technology Group Limited (ASX:MAQ) is an Australian data centre, cloud, cyber security, and telecom services provider. The company primarily serves mid-to-large businesses and government clients. In the 12 months ended 30 June 2025 (FY25), the company recorded revenue growth and continued investment in expanding its Macquarie Data Centres (MDC) platform.
FY25 Financial Performance
MAQ’s revenue increased 1.7% YoY to AUD 363.3 million, underpinned by a 14.1% annual rise in Data Centre revenue. Earnings before interest, tax, depreciation, and amortisation (EBITDA) grew 4.1% YoY to AUD 113.6 million in FY25 and NPAT rose 5.7% YoY to AUD 34.9 million, compared with AUD 33 million in FY24.
The company entered a put and call option agreement during the reporting period to acquire a large land parcel in Sydney for a new data centre campus.
The company reported ongoing progress at its Macquarie Park Data Centre Campus, where around 5% of capacity remains available for sale before the IC3 SuperWest launch. The FY25 average EBITDA per megawatt sold stood at approximately AUD 1.8 million.
Operational Updates
On 29 August 2025, MAQ announced leadership changes, with Justin Forsell retiring as Company Secretary effective 5 September 2025. Michael Gold, who previously held the position from June 2019 to May 2024, has been reappointed to the role.
Outlook for FY26
MAQ expects marginal EBITDA growth in FY26, backed by continuous investment in talent and capabilities. The company is aligning headcount with revenue trends to maintain operational efficiency. Furthermore, artificial intelligence (AI) capabilities are being developed both for customers and internal operations to improve service delivery and productivity.
Key Positives and Negatives
Financial metrics showed improvement in certain areas. Operating margin rose to 15.5% in FY25 compared to 14.1% in FY24, while the debt-to-equity ratio improved to 0.26x from 0.29x. However, the company’s current ratio declined to 1.14x in FY25, from 2.0x in FY24, while the asset turnover ratio slipped to 0.52x from 0.59x.
Share performance of MAQ
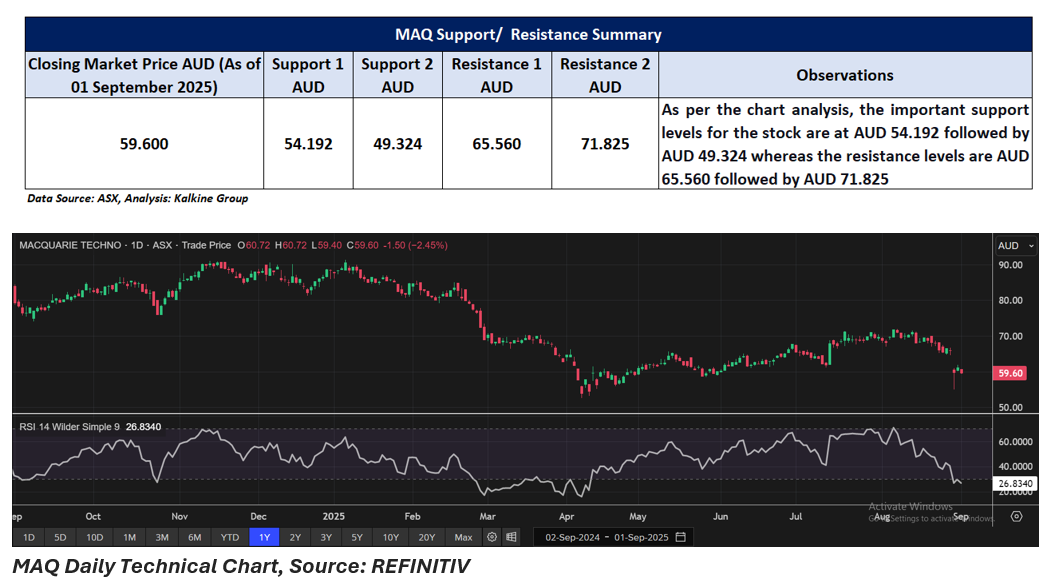
MAQ shares fell by 2.45% to close at AUD 59.600 per share on 01 September 2025. In a year, MAQ's share price has dropped 29.51% and it is down 15.23% over six months, and 13.36% over one month. Over the past three months, the decline was smaller at 1.19%, while year-to-date the stock has fallen 32.51%.
The company’s 52-week high is AUD 91.390, recorded on 7 January 2025, while its 52-week low is AUD 52.660, reached on 7 April 2025.
Support and Resistance Summary
Note 1: Past performance is neither an Indicator nor a guarantee of future performance.
Note 2: The reference date for all price data, and currency, is 01 September 2025. The reference data in this report has been partly sourced from EODHD/Others.
Technical Indicators Defined:
Support: A level at which the stock prices tend to find support if they are falling, and a downtrend may take a pause backed by demand or buying interest. Support 1 refers to the nearby support level for the stock and if the price breaches the level, then Support 2 may act as the crucial support level for the stock.
Resistance: A level at which the stock prices tend to find resistance when they are rising, and an uptrend may take a pause due to profit booking or selling interest. Resistance 1 refers to the nearby resistance level for the stock and if the price surpasses the level, then Resistance 2 may act as the crucial resistance level for the stock.


 Nov 12, 2026





 Please wait processing your request...