
 CA
 NZ
 UK
 US
 IND

 AU

 Share
 X (Formerly Twitter)
 Whatsapp
 Facebook
 LinkedIn
 Telegram
 Email This Article
 Copy Link
 Summarize with AI
 Chat GPT
 Perplexity

Key Highlights
- Lovisa Holdings is a global fast-fashion jewellery retailer operating an expanding international store network.
- FY26 sales increased to approximately $938.8 million, compared with $798.1 million in FY25, while Net Income rose to approximately $95.6 million.
- Lovisa's growth strategy continues to be supported by international store expansion, with 1,095 stores reported at the end of 1H FY26 after 85 new stores were opened during the half.
- Technically, LOV has broken above a significant long-term descending Trendline that had constrained the share price since its 2025 peak.
- The breakout was accompanied by a Rising Window, providing additional evidence of strong buying pressure.
- The share price closed at $27.62 on 26 August 2026, representing a 12.73% gain for the session.
- The chart identifies significant resistance around $33.76, which represents the next major upside objective.
Lovisa Holdings Limited (ASX: LOV) has reached an important technical inflection point after breaking above a long-term descending trendline. The Daily Chart shows the share price moving decisively above the trendline, accompanied by a Rising Window and a sharp increase in buying interest. This combination provides confirmation that momentum has strengthened and improves the stock's near-term bullish outlook.
Strong Fundamental Backdrop
Lovisa has continued to deliver strong sales growth while expanding its global store network. For FY26, the company reported sales of approximately $938.8 million, up from $798.1 million in the previous financial year, while net income increased to approximately $95.6 million.
The company's international expansion remains an important component of its growth strategy. During 1H FY26, Lovisa opened 85 new stores, taking its store network to 1,095 locations at the half-year stage. Revenue increased 23.3% to $500.7 million, while underlying EBIT rose 20.4% to $109.1 million.
This combination of strong revenue growth, improving profitability and continued store expansion provides a supportive fundamental backdrop for the recent technical breakout.
Associated Risks
The recent breakout remains dependent on LOV sustaining its position above the broken descending trendline. A failure to hold above this area could result in a false breakout and trigger a pullback towards the recent consolidation range.
The Rising Window shown on the daily chart also represents an important technical feature. A decisive move back below the gap area would weaken the immediate bullish structure and could indicate that the recent buying pressure is fading.
Lovisa also remains exposed to the risks associated with international retail operations. Changes in consumer spending, foreign exchange movements, rental costs and competitive conditions could affect sales and profitability.
The company's rapid store expansion also creates execution risks. Maintaining store productivity while expanding across multiple international markets will remain important for sustaining its growth trajectory.
Technical Outlook
LOV's daily chart has broken above a long-term descending trendline, with the breakout supported by a Rising Window and strong upward price momentum, strengthening the bullish technical outlook.
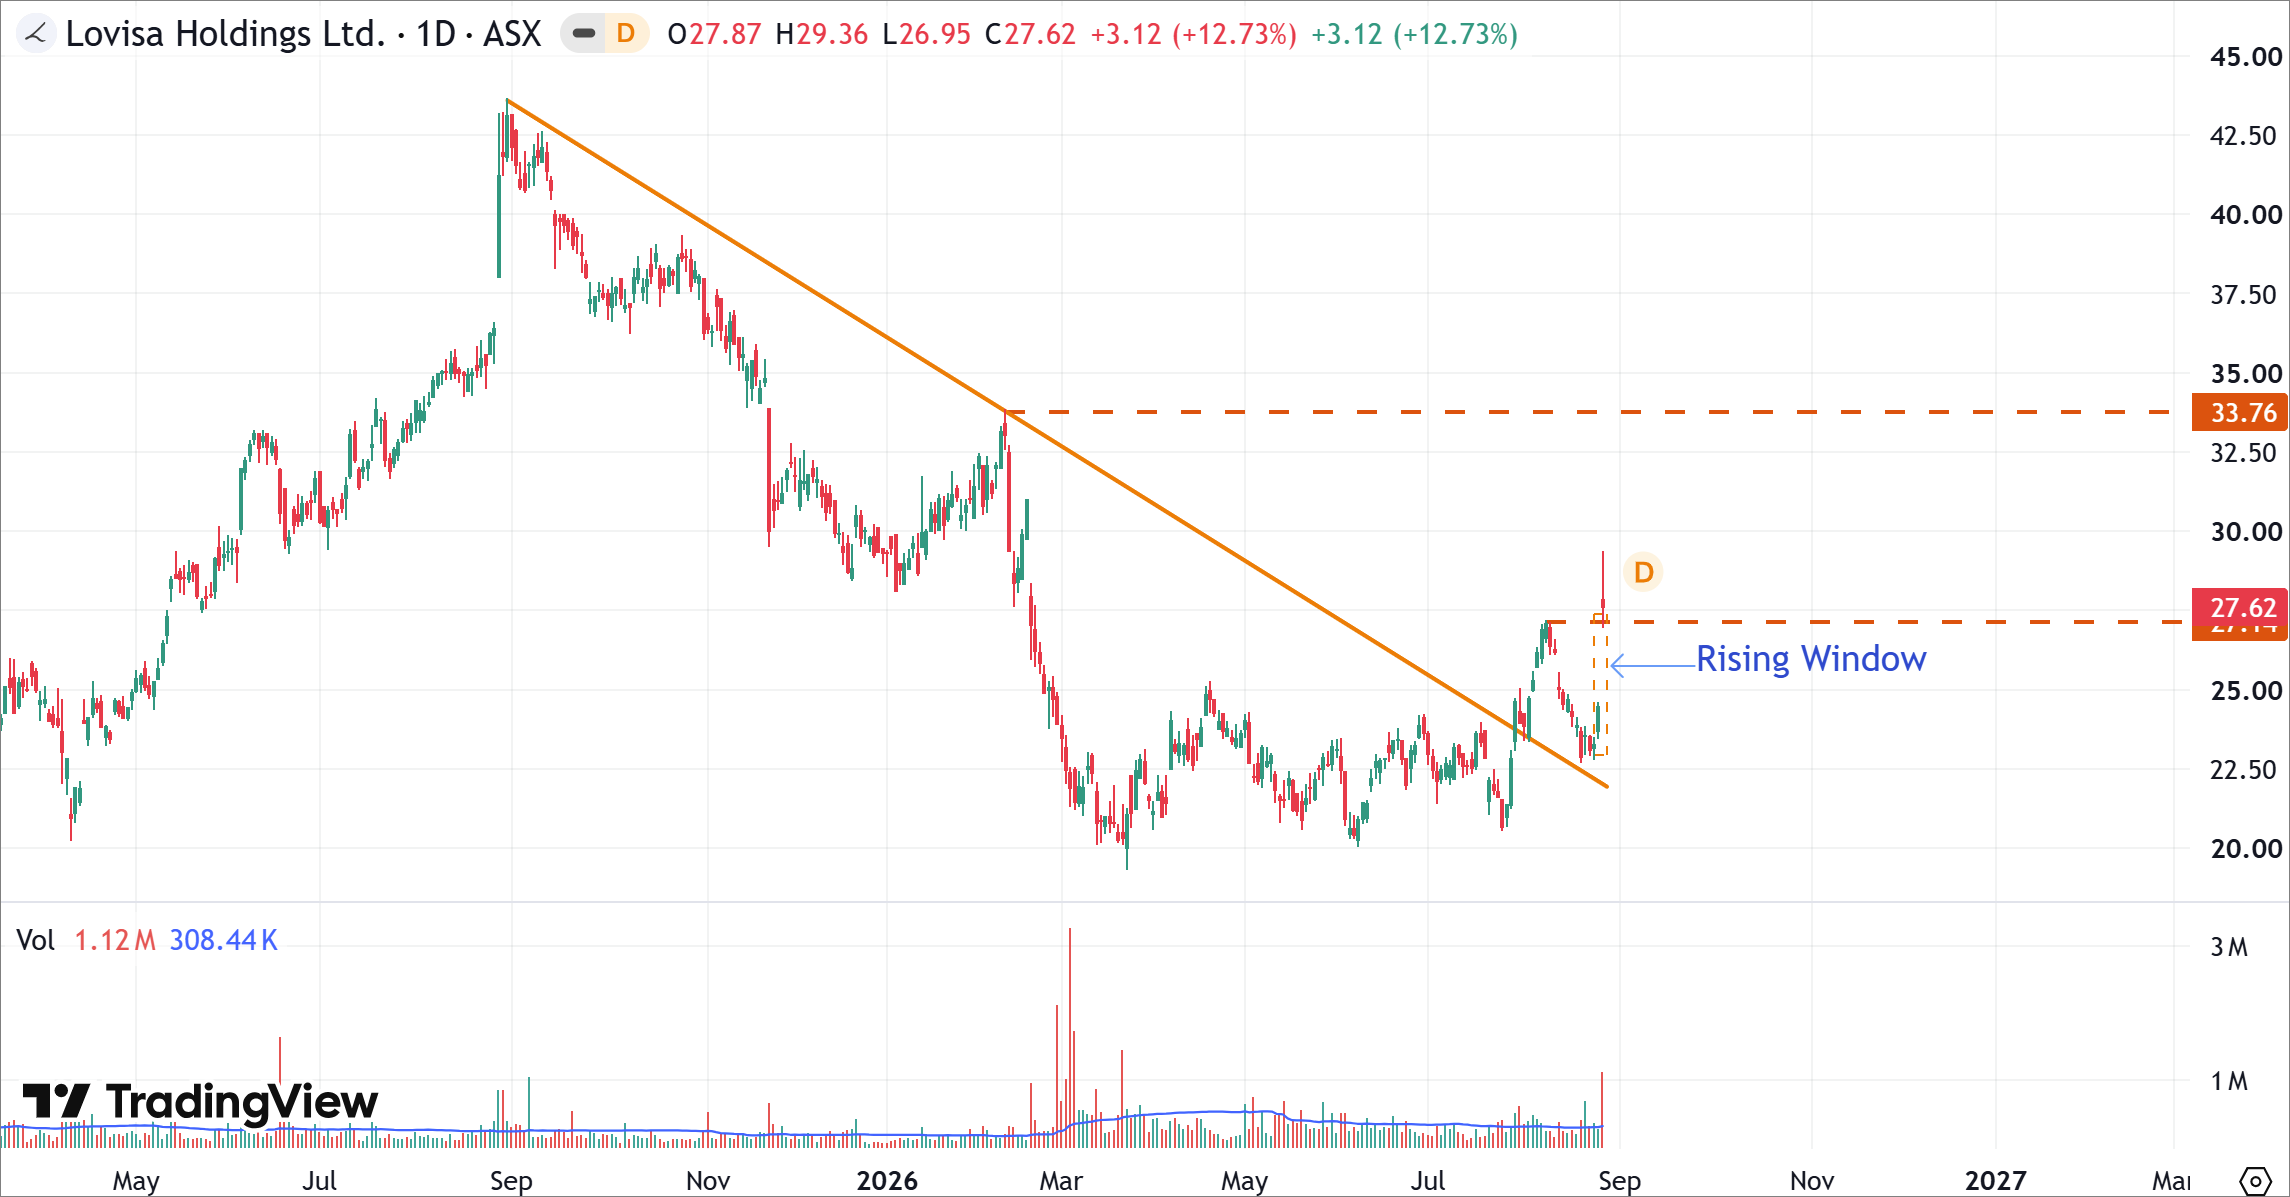
LOV's Daily Price Chart (at the closing price of 26/08/2026). Powered by: tradingview.com.
- LOV has broken above the descending orange trendline that had connected the major peak in 2025 with subsequent lower highs.
- A Rising Window has appeared during the breakout, highlighting a strong upward price gap and indicating increased buying pressure.
- Trading Volume also expanded significantly, with approximately 1.12 million shares traded, providing additional confirmation of increased market participation.
- The chart identifies major resistance around $33.76, representing the next significant upside objective.
- The broken descending trendline is now an important potential support area. A successful retest and hold above this level would strengthen the breakout structure.
Bottom Line
Lovisa's strong FY26 sales growth, improving profitability and continued international store expansion provide a supportive fundamental backdrop for the recent share-price strength. The company's global expansion remains an important driver of its longer-term growth outlook.
Technically, LOV has delivered a significant bullish breakout above its long-term descending trendline. The move is particularly notable because it was accompanied by a Rising Window, strong price momentum and increased trading volume.
The breakout opens the potential for further upside towards the chart-based resistance level of approximately $33.76. The broken trendline and the Rising Window area are now the key levels to monitor. Sustained trading above these areas would keep the bullish breakout structure intact, while a decisive move back below them could raise the risk of a failed breakout.


 Nov 12, 2026





 Please wait processing your request...