
 CA
 NZ
 UK
 US
 IND

 AU

 Share
 X (Formerly Twitter)
 Whatsapp
 Facebook
 LinkedIn
 Telegram
 Email This Article
 Copy Link
 Summarize with AI
 Chat GPT
 Perplexity

Image source: Shutterstock
Highlights
- Life360 subscriptions increased by 29% YoY in FY24, driving 26% YoY subscription revenue growth.
- Adjusted EBITDA jumped 120.9% YoY in FY24, while cash balance more than doubled.
- Life360 was added to the S&P/ASX 100 Index in March 2025, marking a major milestone in the company’s journey.
Life360 Inc. (ASX:360) is a provider of location-based tracking and messaging solutions for safety and coordination. In the full year ended 31 December 2024 (FY24), the company posted a 22% YoY increase in total revenue, reaching USD 371.5 million, up from USD 304.5 million in FY23. During the period, the subscription revenue climbed 26% YoY, supported by a 29% YoY rise in Life360 subscriptions.
Adjusted EBITDA surged 120.9% YoY to USD 45.5 million in FY24, compared to USD 20.6 million in the previous year. At the same time, cash and cash equivalents more than doubled, rising 127% YoY to USD 160.5 million and operating cash flow increased by 333% YoY.
On the market front, Life360’s inclusion in the S&P/ASX 100 Index (effective from March 24, 2025) marked a major milestone.
Hardware revenue declined by 1% YoY, and operating expenses rose by 14% YoY in FY24.
Outlook
Looking ahead, Life360 expects consolidated revenue for FY25 to range between USD 450–480 million, with USD 350–360 million from subscriptions. Adjusted EBITDA is projected between USD 65–75 million, factoring in USD 8 million investment for the launch of a new pet device. The company is scheduled to report its Q1 FY25 earnings on 13 May 2025.
Share performance of 360
360 ended the session 0.36% lower at AUD 19.18 on 16 April 2025. The company’s shares have risen 47.09% over the past year but are down 14.91% year-to-date. The stock hit a 52-week high of AUD 27.18 on 4 December 2024 and a 52-week low of AUD 12.55 on 19 April 2024.
Support and Resistance Summary
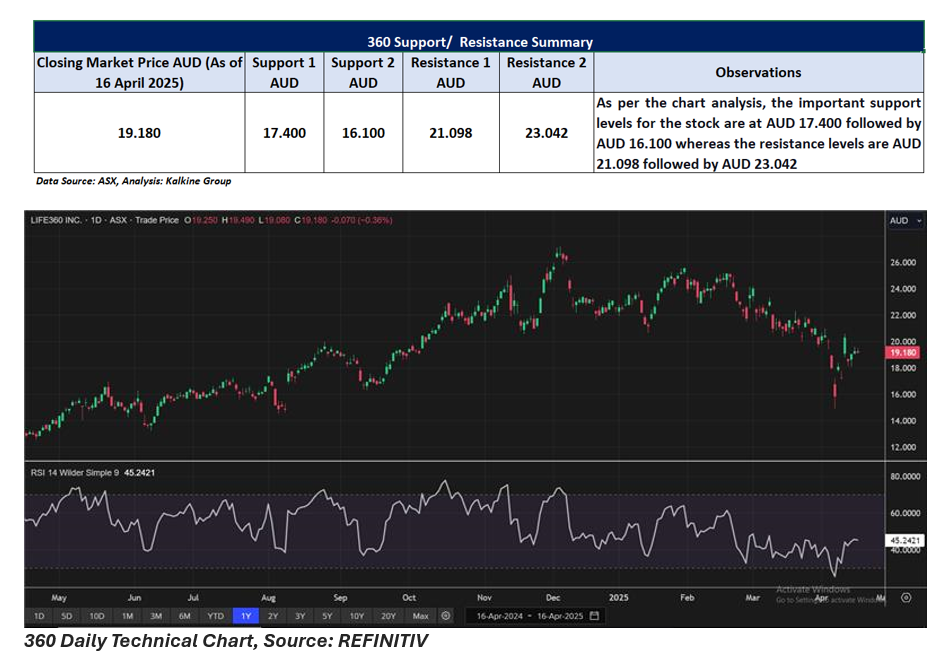
Note 1: Past performance is neither an Indicator nor a guarantee of future performance.
Note 2: The reference date for all price data, and currency, is 16 April 2025. The reference data in this report has been partly sourced from EODHD/Others.
Technical Indicators Defined:
Support: A level at which the stock prices tend to find support if they are falling, and a downtrend may take a pause backed by demand or buying interest. Support 1 refers to the nearby support level for the stock and if the price breaches the level, then Support 2 may act as the crucial support level for the stock.
Resistance: A level at which the stock prices tend to find resistance when they are rising, and an uptrend may take a pause due to profit booking or selling interest. Resistance 1 refers to the nearby resistance level for the stock and if the price surpasses the level, then Resistance 2 may act as the crucial resistance level for the stock.


 Nov 12, 2026





 Please wait processing your request...