
 CA
 NZ
 UK
 US
 IND

 AU

 Share
 X (Formerly Twitter)
 Whatsapp
 Facebook
 LinkedIn
 Telegram
 Email This Article
 Copy Link
 Summarize with AI
 Chat GPT
 Perplexity

Highlights
- Life360’s 3Q FY25 revenue rose 34% year-on-year to USD 124.5 million.
- Gross margin improved to 78%, up from 75.4% in 3QFY24.
- Life360 announced USD 120 million acquisition of Nativo to expand advertising capabilities.
Life360, Inc. (ASX:360) provides a platform focused on family safety and connectivity, supporting more than 90 million users globally. Through its mobile application and Tile tracking devices, the company enables families to stay connected via location sharing, safety alerts, and device tracking.
Financial Performance
For the third quarter of financial year 2025 (3Q FY25), 360 reported revenue of USD 124.5 million, up from USD 92.9 million in 3Q FY24, reflecting a 34.0% YoY increase supported by subscription growth, higher ARPPC, international uptake, and expanding data-driven partnerships. Gross profit rose to USD 97.1 million in 3Q FY25 from USD 70.0 million 3Q FY24, marking a 38.7% YoY improvement as enhanced margins (reached 78%, compared to 75.4% in previous corresponding period), controlled operating expenses, stable operating cash flow, and a scalable subscription model continued to support earnings. Cash, cash equivalents, and restricted cash rose to USD 457.2 million in 3Q FY25 from USD 160.2 million 3Q FY24, making a 185.4% YoY improvement.
Business Update
On 10 November 2025, 360 announced that it will acquire advertising technology firm Nativo for approximately USD 120 million through a combination of cash and stock. The transaction will integrate 360’s family and location insights with Nativo’s publisher network and advertising capabilities.
The combined resources aim to deliver scalable, contextual, and non-intrusive advertising across the Life360 app, connected TV, mobile, and web platforms. The acquisition is expected to accelerate platform development, broaden audience reach, and establish a privacy-centric advertising ecosystem.
Key Positives and Negatives
In 3QFY25, 360’s current ratio rose to 6.80x in 3Q FY25 from 2.76x in 3Q FY25. The asset turnover ratio fell to 0.16x in 3Q FY25 from 0.22x in 3Q FY25, and the cash conversion cycle extended to 67.8 days from 26 days in the same period last year.
Business Outlook
For FY25, Life360 has raised total revenue guidance to USD 474–485 million, up from USD 462–482 million, driven by subscription revenue of USD 366–368 million, hardware revenue of USD 46–50 million, and other revenue of USD 62–67 million. Adjusted EBITDA is projected at USD 84–88 million, higher than the previous range of USD 72–82 million.
The company expects growth in Paying circles through higher conversion, expanded product bundles, and international expansion, which is further expected to drive subscription revenue and AMR growth. Improved revenue scale, sales efficiency, and a favorable subscription mix are anticipated to enhance margins and support stable operating cash flow throughout FY25.
Share Performance of 360
360’s shares were trading at AUD 36.510 per share on 21 November 2025 with an intraday gain of 0.11%. 360’s stock has decreased by 20.78% in the last three months, increased by 15.68% over the six months and jumped 68.17% over the past year. 360’s 52-week high is AUD 55.87, recorded on 06 October 2025, and 52-week low is AUD 14.930, recorded on 07 April 2025.
Support and Resistance Summary
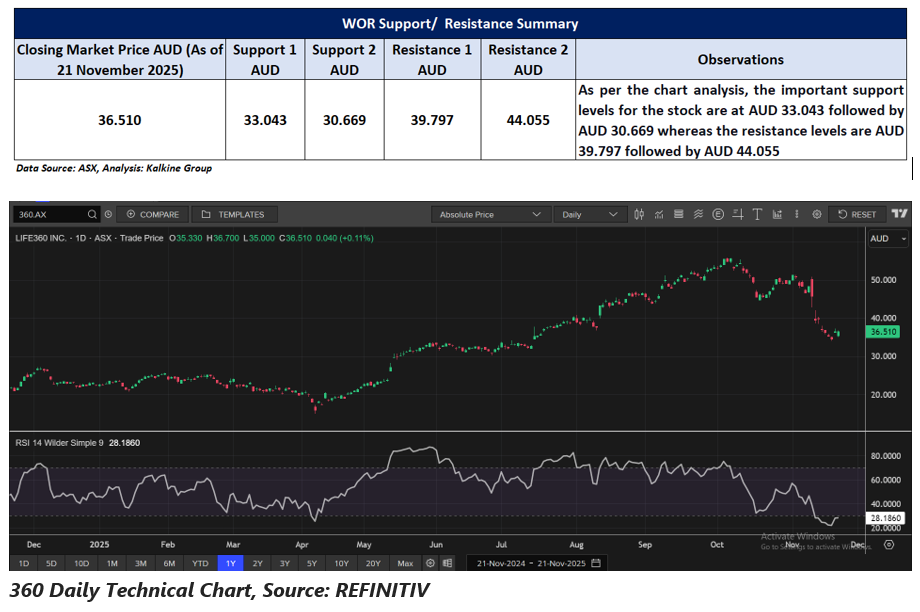
Note 1: Past performance is neither an Indicator nor a guarantee of future performance.
Note 2: The reference date for all price data, and currency, is 21 November 2025. The reference data in this report has been partly sourced from EODHD/Others.
Technical Indicators Defined:
Support: A level at which the stock prices tend to find support if they are falling, and a downtrend may take a pause backed by demand or buying interest. Support 1 refers to the nearby support level for the stock and if the price breaches the level, then Support 2 may act as the crucial support level for the stock.
Resistance: A level at which the stock prices tend to find resistance when they are rising, and an uptrend may take a pause due to profit booking or selling interest. Resistance 1 refers to the nearby resistance level for the stock and if the price surpasses the level, then Resistance 2 may act as the crucial resistance level for the stock.


 Nov 12, 2026





 Please wait processing your request...